Calculate the available water capacity of a soil (TAW and RAW)
 Akuasense
The total available water (TAW) of a soil, often called its available water capacity, is the amount of water it can release to a crop over the whole depth of its roots; it is expressed in mm of water. The calculator below lets you estimate it by entering the texture of your soil, horizon by horizon, then derives the readily available water (RAW) of your crop. The concepts it relies on are developed in the article Should you refill the soil’s available water before summer?.
Below the calculator you will find the definitions of all the technical terms it uses, together with its instructions for use.
Estimate how much water your soil can supply to your crop (TAW and RAW), horizon by horizon.
The calculation link is incomplete or contains an unknown value: the default example is shown.
-
Your crop
Depletion fraction p of 0.50, the value FAO cites as commonly used.
Irrigation method
Drip: micro-sprinkler included. Other: sprinkler, surface irrigation or rainfed.
Set the rooting depth you observe in your field.
-
Your soil, horizon by horizon
Describe each horizon, from the surface downwards: one tab per horizon. The profile is redrawn after each change.
Available water held by each horizon
From 0 to 30 cm
What you know about this horizon
1.95 mm of water per cm of fine earth 59 mm of water
USDA class Silt loam, Saxton and Rawls (2006)
-
The result
Run the simulation to calculate the result with your settings.
Total available water (TAW)
73mm of water
over 60 cm of root zone, i.e. 730 m³/ha
Readily available water (RAW)
37mm of water
depletion fraction p of 0.50 for this crop
RAW during a heatwave
22mm of water
for an ETc of 10 mm of water per day (p of 0.30)
readily available: 37 mmharder to extract: 37 mm
Without rain or irrigation, a crop with an ETc of 5 mm of water per day uses up this RAW in about 7 days.
Receive this simulation by email
A summary of this calculation and a link to reopen it, sent to your inbox.
If it has not arrived within a few minutes, please check your spam folder.
Thank you for your feedback.
It helps us improve this calculator.
How to use the available water capacity calculator
The calculator is completed in three steps, in order: your crop, your soil, then reading the result. Each change of setting updates the soil profile diagram and the result.
1. Choose your crop and its rooting depth
Choosing your crop sets two values: the depletion fraction p and a range of rooting depths. These are the values used by the hub, the web app for Akuasense connected soil moisture probes. Fraction p comes, depending on the crop, from Table 22 of FAO-564 or from its 2021 update by Pereira and colleagues5,6. Rooting depth comes from the revised FAO-56 of 2025 for vegetables and field crops7, and from Table 22 for lucerne and grassland4. For trees, vines, small fruit and hops, it also depends on your irrigation method (see below).
The depletion fraction p is the part of TAW your crop can use without suffering from a lack of water. While the soil is well supplied with water, it delivers it fast enough to meet the crop’s demand, and the crop transpires normally. As the soil dries, the remaining water is held more and more tightly and reaches the roots more and more slowly. Below a threshold, it can no longer reach them fast enough to meet the transpiration demand: the crop reduces its transpiration, and water stress begins, well before the wilting point4. The fraction p sets this threshold: with a fraction p of 0.50, the crop can use half of TAW before stress begins. Multiplied by TAW, it gives RAW.
Rooting depth is the depth down to which the crop’s roots take up water. It depends on the species and its age, but also on the soil: a compacted horizon, bedrock or a water table stops the roots. It is best observed in a soil pit, or otherwise with an auger8.
FAO specifies that the upper value of the range applies to soils with no significant layering or other characteristics that restrict rooting depth, and that the lower value may be used for irrigation scheduling and the upper value for modelling water stress or for rainfed conditions4. Pereira and colleagues add that the lower value suits heavy soils and frequent irrigation, and the upper value light soils and longer intervals between irrigations5. The calculator uses the lower value, as the hub does, and shows the crop’s range.
For trees, vines, small fruit and hops, the calculator also asks for your irrigation method. FAO gives them only a maximum depth, valid in a soil with no obstacle4, and its 2025 revision gives them none7. Yet under drip irrigation, most of the roots and of the water uptake stay much higher, according to field studies and extension guides: 30 to 60 cm for most fruit trees, 60 to 100 cm for vines and almond, 90 to 150 cm for pistachio and walnut (Table 6). Some roots go deeper. If you irrigate by drip or micro-sprinkler, the calculator therefore uses this zone; with sprinklers, surface irrigation or no irrigation, it uses Table 22 of FAO-56.
If roots stop higher in your field, or go deeper, the “Set manually” button opens a slider to enter the observed depth, from 20 to 250 cm. For “Other crop”, the slider is shown straight away.
2. Describe your soil, horizon by horizon
A horizon is a layer of soil with uniform characteristics. In a soil pit, or in the cores brought up by an auger, one horizon gives way to the next when the colour, texture, structure or stone content changes. The calculator accepts up to five horizons, described from the surface downwards; each tab describes one, with its thickness.
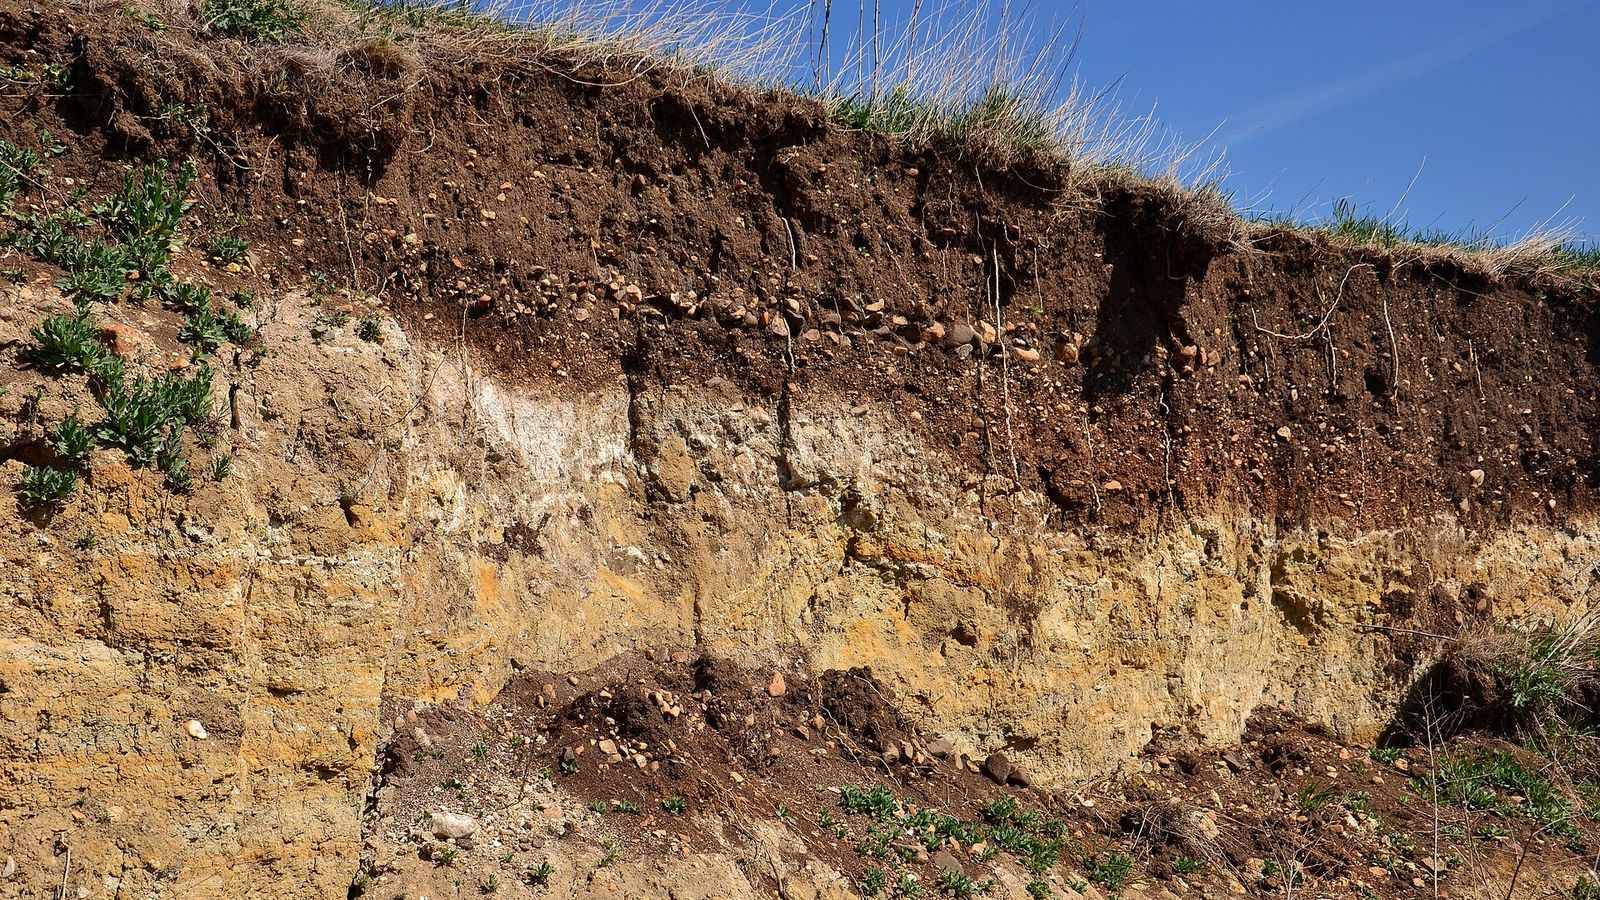
In this photo, taken beside a road near Libědice, in the Czech Republic, the boundary between the dark brown, stony surface horizon and the pale horizon beneath it is visible to the naked eye.
For each horizon, there are three ways to enter the water it holds, from the simplest to the most precise.
- Its texture. A class of the USDA texture triangle, the US classification the hub uses, with the values of Saxton and Rawls1; or a class of the French (Aisne) texture triangle, with the values of Bruand, Duval and Cousin2. The latter were measured on undisturbed soil clods, and distinguish the tilled horizon (A) from the deeper horizons (E, B or C). They do not cover calcareous horizons, and some classes have no value: the calculator flags them. The Aisne classes keep their French codes and names, as they have no official English names.
- A particle-size analysis. The proportions of sand, silt and clay from the laboratory report, and the organic matter content (2.5% if the report does not give it). The calculator derives the water contents at field capacity and at the wilting point with the equations of Saxton and Rawls1, and places the point on the USDA triangle.
- Laboratory measurements. The volumetric water contents measured at field capacity (pF 2) and at the wilting point (pF 4.2), on undisturbed clods3. A laboratory often reports a gravimetric water content, in grams of water per gram of dry soil: it is converted into a volumetric water content by multiplying it by the bulk density of the soil, in g/cm³3. Example: a gravimetric water content of 22% in a soil with a bulk density of 1.4 g/cm³ corresponds to a volumetric water content of 22 × 1.4 = 30.8%.
Stones and gravel. Finally, for each horizon, the calculator asks for the share of stones and gravel, or rock fragments. They occupy part of the horizon’s volume, which therefore contains no fine earth. Their proportion is estimated by eye, with reference charts, or measured on a sample of about twenty kilograms; the two methods can give quite different results3. Arvalis considers that rock fragments can be ignored below 10% of the volume3.
Their type also matters: flint holds almost no water, whereas limestone or chalk does. The calculator applies the values used by Arvalis for each type (Table 4). For a loamy clay horizon containing 30% stones, Tetegan and colleagues calculated that ignoring this water underestimates the available water by 5% with chert and by 33% with chalk9.
3. Read the result and share the calculation
The profile shows each horizon to scale. The blue area represents the available water it holds within the root zone, and its value in mm of water is shown in the horizon; the part of a horizon below the roots is not counted. The result gives TAW, RAW and RAW during a heatwave, explained in the next part.
The “Copy the link to this calculation” button copies a URL that contains every setting: opened in a browser, it displays the same calculation. It can be used to save a soil description or to share it with an advisor.
Format of the calculation link
The page URL accepts the following parameters, which are the same in every language:
crop: crop identifier (Tables 5 and 6), orotherfor a crop not listed;root: rooting depth, in cm, a multiple of 5 from 20 to 250; if it differs from the crop’s lower value, the calculator opens the manual setting;irrigation(optional, crops in Table 6 only):dripfor drip or micro-sprinkler irrigation, the default, orotherfor sprinkler, surface irrigation or no irrigation;h: one horizon, one to five of them, repeated from the surface downwards, in the formthickness,description[,stones:percentage:type], the thickness in cm, a multiple of 5 from 5 to 150, the stone percentage a multiple of 5 from 0 to 80. The description takes one of the following forms:usda:class, with the identifier of the USDA class (Table 2);aisne:code:Aoraisne:code:EBC, with the code of the Aisne triangle class and the type of horizon (Table 3);granulo:sand-silt-clay-organic matter, in %, sand + silt + clay adding up to 100;labo:field capacity-wilting point, in % by volume, the first greater than the second.
- The stone type is one of the identifiers in Table 4.
crop, root and h are required, and decimals use a point. An incomplete link, or one with a value outside these limits, shows the default example with a message.
Example: https://akuasense.com/en/blog/available-water-capacity-calculator/?crop=grapevine-wine-grape&root=40&h=40,aisne:AL:A,stones:30:limestone describes a 40 cm clay-limestone soil with 30% limestone stones under a wine grape vineyard; the calculator shows a TAW of 50 mm of water and a RAW of 22 mm.
Interpreting the result: TAW, RAW and RAW during a heatwave
What the three figures mean
TAW is the water the soil can release to the crop over the whole root zone: the water held between field capacity and the permanent wilting point4. It is expressed in mm of water; 1 mm of water equals 1 litre per square metre, or 10 m³ per hectare. A TAW of 73 mm thus represents 730 m³ of water per hectare.
RAW is the part of TAW the crop extracts without reducing its transpiration. Once RAW has been used up, the remaining water is held more strongly; the crop partially closes its stomata, and water stress begins. For each crop, FAO publishes the depletion fraction p that gives RAW, valid for an ETc of 5 mm of water per day; it generally ranges from 0.30 to 0.70, and a value of 0.50 is commonly used for many crops4.
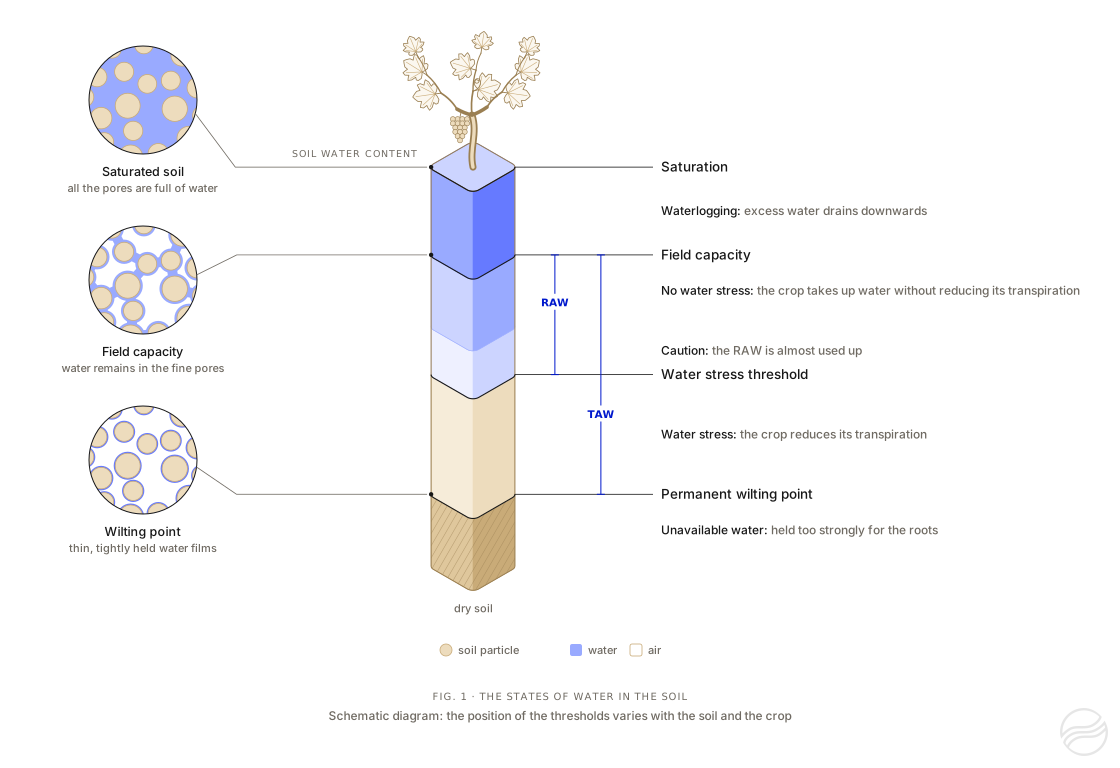
Figure 1. The states of water in the soil. On the left, soil particles under a magnifying glass: at saturation, water fills all the pores; at field capacity, it occupies only the finest pores; at the wilting point, only thin films remain around the particles. In the centre, the soil water content, from dry soil (beige) to saturation (blue), and the four thresholds that separate the states of water for the crop. The vine planted on top of the scale represents the crop; the animation shows how it responds to each state of the water. Schematic diagram: the position of the thresholds varies with the soil and the crop.
RAW during a heatwave takes into account that the fraction p decreases as ETc increases: the roots can no longer extract water fast enough. FAO adjusts it with the formula below, the fraction remaining between 0.1 and 0.84. The calculator applies it for an ETc of 10 mm of water per day: this is the ETo recorded by Arvalis at the peak of the heatwave of late June 202610, and the ETc of a crop whose foliage covers the ground is of the same order.
: available water held by a horizon within the root zone, in mm of water
: available water capacity of the fine earth of the horizon, in mm of water per cm, that is , with the water contents in m³ of water per m³ of soil
: share of the horizon volume occupied by rock fragments (stones and gravel), from 0 to 1 (0.30 for 30%); : water held by the stones, in mm of water per cm of stones
: thickness of the horizon within the root zone, in cm
example: a 30 cm silt loam horizon over a 30 cm sand horizon, without stones, holds mm of water; with , RAW is 37 mm; for an ETc of 10 mm of water per day, and RAW falls to 22 mm
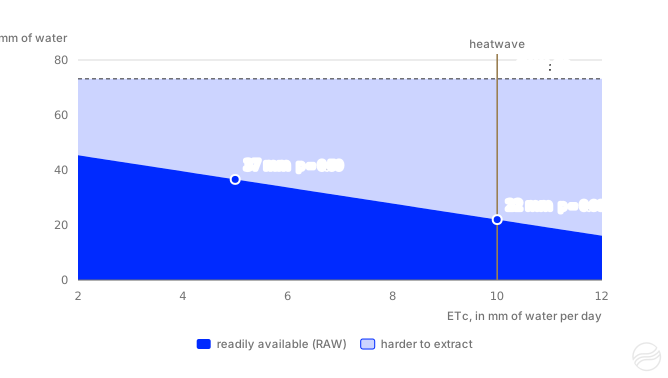
Figure 2. RAW as a function of ETc, for the TAW of the example: 73 mm of water, silt loam over sand, depletion fraction of 0.50. Adjusted with the FAO formula4, the fraction p goes from 0.50 for an ETc of 5 mm of water per day to 0.30 for 10 mm: RAW falls from 37 to 22 mm of water, and it is used up in about 2 days instead of 7.
What the result can be used for
- Estimating how many days RAW lasts. Without rain or irrigation, a full RAW lasts, as a first approximation, a number of days equal to RAW divided by ETc: 37 mm of water for an ETc of 5 mm of water per day lasts about 7 days. This period shortens quickly as ETc rises, since RAW decreases at the same time: for an ETc of 10 mm of water per day, the 22 mm of RAW in the example lasts about 2 days (Figure 2).
- Putting an irrigation application in context. FAO specifies that the net depth of an irrigation should be smaller than or equal to the root zone depletion, and that water applied above field capacity drains below the roots4. On a root zone whose RAW has just been used up, a net application larger than RAW, 37 mm in the example, therefore exceeds field capacity. With drip irrigation, only part of the soil surface is wetted, around 30 to 40% according to FAO4: the water is spread over a smaller volume of soil, and this calculation does not apply as it stands.
- Comparing. Two horizons, two fields, two rooting depths: the calculator shows which horizon holds the most water, and how much TAW changes when roots reach a few centimetres deeper or shallower.
Putting the result in context
For a uniform horizon without stones, the available water per cm of soil depends first on texture: around 0.5 to 1.1 mm of water per cm for a sand, and 1.3 to 1.9 mm for a loam or a silt loam, according to the water contents published in FAO-564 (Table 1).
Over a real profile, TAW also depends on the depth the roots explore and on the stones: it is much lower as soon as a calcareous horizon or bedrock stops the roots close to the surface, or when stones are abundant. Two examples from France:
- Boigneville (Essonne), Arvalis experimental farm. The TAW of a clay-limestone soil (French argilo-calcaire) whose top 40 cm lie on a highly calcareous horizon is around 55 mm of water; that of a neighbouring clay loam, where hard limestone appears only below 120 cm, is around 120 mm11.
- Poitou-Charentes. The regional soil reference system uses 60 to 80 mm of water for shallow groie soils and 110 to 130 mm for deep groies, classes of that reference system12.
Table 1. Orders of magnitude of TAW according to texture
| Horizon texture (USDA class) | mm of water per cm of soil | TAW over 30 cm (mm of water) | over 60 cm | over 90 cm |
|---|---|---|---|---|
| Sand | 0.5–1.1 | 15–33 | 30–66 | 45–99 |
| Sandy loam | 1.1–1.5 | 33–45 | 66–90 | 99–135 |
| Loam, silt loam | 1.3–1.9 | 39–57 | 78–114 | 117–171 |
| Clay | 1.2–2.0 | 36–60 | 72–120 | 108–180 |
Accuracy and limitations
The result is an order of magnitude, for four reasons.
- A texture class covers a range of soils. For French soils, the root mean square error of an available water capacity estimated from the texture class alone is 0.047 to 0.058 cm³ of water per cm³ of soil, that is 0.47 to 0.58 mm of water per cm13. Over a 60 cm horizon, this represents around 30 mm of water. Within a single class of the Aisne triangle, the standard deviation of the available water capacity ranges from 0.15 to 0.50 mm of water per cm, because of differences in soil structure2.
- Two definitions of field capacity coexist. Saxton and Rawls set it at a tension of 33 kPa1, the French references at 10 kPa (pF 2)2. For the same soil, the latter gives a higher field capacity, and therefore a larger available water capacity: for a sand, 0.49 mm of water per cm with the USDA classes, compared with 0.60 to 0.73 mm with the Aisne triangle (Tables 2 and 3).
- Rooting depth matters as much as texture. In a uniform soil, TAW is proportional to it: using 80 cm instead of 60 cm increases it by a third.
- Stones and compaction change the water held. The calculator accounts for stones according to their type, but not for compaction, which only a measurement captures.
Methods based on local measurements are the most precise3: water contents measured in the laboratory on each horizon, or monitoring soil moisture at several depths, which shows the water the crop actually uses.
The values used by the calculator
The calculator uses only the values below and the formulas on this page: the same calculation can be done by hand.
Table 2. USDA texture classes: water contents and water held
| USDA texture class | Identifier | θ at field capacity (% vol.) | θ at wilting point (% vol.) | mm of water per cm |
|---|---|---|---|---|
| Sand | sand | 9.9 | 5.0 | 0.49 |
| Loamy sand | loamy-sand | 13.2 | 6.8 | 0.63 |
| Sandy loam | sandy-loam | 18.7 | 9.2 | 0.95 |
| Loam | loam | 26.9 | 12.6 | 1.43 |
| Silt loam | silt-loam | 30.5 | 11.0 | 1.95 |
| Silt | silt | 31.1 | 5.8 | 2.53 |
| Sandy clay loam | sandy-clay-loam | 27.8 | 17.7 | 1.01 |
| Clay loam | clay-loam | 35.7 | 21.8 | 1.39 |
| Silty clay loam | silty-clay-loam | 37.9 | 21.0 | 1.69 |
| Sandy clay | sandy-clay | 37.7 | 26.6 | 1.11 |
| Silty clay | silty-clay | 41.6 | 27.7 | 1.39 |
| Clay | clay | 45.1 | 34.0 | 1.11 |
Table 3. Classes of the French (Aisne) texture triangle: water held by the fine earth
| Code | Aisne triangle class | Tilled horizon (A), mm of water per cm | Deeper horizons (E, B, C), mm of water per cm |
|---|---|---|---|
ALO | Argile lourde | 1.24 | 1.12 |
AL | Argile limoneuse | 1.36 | 1.13 |
A | Argile | — | 0.93 |
AS | Argile sableuse | 1.73 | 0.95 |
LA | Limon argileux | 1.73 | 1.49 |
LAS | Limon argilo-sableux | 1.67 | 1.48 |
LSA | Limon sablo-argileux | 1.43 | 1.27 |
LM | Limon moyen | 2.13 | 2.07 |
LMS | Limon moyen sableux | 1.83 | 1.96 |
LL | Limon léger | — | — |
LLS | Limon léger sableux | — | — |
LS | Limon sableux | 1.62 | — |
SA | Sable argileux | 1.28 | 1.03 |
SL | Sable limoneux | 1.31 | 1.16 |
S | Sable | 0.60 | 0.73 |
Table 4. Water held by stones according to their type
| Stone type | Identifier | mm of water per cm of stones |
|---|---|---|
| Inert (hold no water) | inert | 0.00 |
| Flint | flint | 0.18 |
| Chert | chert | 0.55 |
| Limestone | limestone | 0.97 |
| Gaize | gaize | 1.91 |
| Chalk | chalk | 2.28 |
Table 5. Depletion fraction p and rooting depth: vegetables, field crops and grassland
| Crop | Identifier | Fraction p | Depth (cm) | Source of fraction p |
|---|---|---|---|---|
| Other crop | other | 0.50 | — | FAO-56 (commonly used fraction p) |
| Aerobic rice | aerobic-rice | 0.35 | 100 | Pereira et al., 2021 (field crops) |
| Artichoke | artichoke | 0.45 | 60–120 | Pereira et al., 2021 (vegetables) |
| Asparagus | asparagus | 0.45 | 120–180 | Pereira et al., 2021 (vegetables) |
| Aubergine | eggplant | 0.45 | 40–100 | Pereira et al., 2021 (vegetables) |
| Beetroot | table-beet | 0.45 | 45–100 | Pereira et al., 2021 (vegetables) |
| Broccoli | broccoli | 0.40 | 40–90 | Pereira et al., 2021 (vegetables) |
| Brussels sprouts | brussels-sprouts | 0.40 | 40–90 | Pereira et al., 2021 (vegetables) |
| Bulb onion | bulb-onion | 0.30 | 30–60 | FAO-56 |
| Cabbage | cabbage | 0.40 | 30–50 | Pereira et al., 2021 (vegetables) |
| Carrot | carrot | 0.30 | 30–50 | Pereira et al., 2021 (vegetables) |
| Castor bean | castor-bean | 0.60 | 80–130 | Pereira et al., 2021 (field crops) |
| Cauliflower | cauliflower | 0.40 | 40–90 | Pereira et al., 2021 (vegetables) |
| Chickpea | chickpea | 0.45 | 70–100 | Pereira et al., 2021 (field crops) |
| Chilli pepper | chili-pepper | 0.30 | 50–120 | Pereira et al., 2021 (vegetables) |
| Cotton | cotton | 0.60 | 100–170 | Pereira et al., 2021 (field crops) |
| Courgette | zucchini | 0.50 | 60–110 | Pereira et al., 2021 (vegetables) |
| Cowpea | cowpea | 0.45 | 60–130 | Pereira et al., 2021 (field crops) |
| Cucumber | cucumber | 0.40 | 60–120 | Pereira et al., 2021 (vegetables) |
| Dry bean | dry-bean | 0.45 | 50–90 | Pereira et al., 2021 (field crops) |
| Durum wheat | durum-wheat | 0.55 | 100–150 | Hub (no row in FAO-56) |
| Faba bean | faba-bean | 0.45 | 50–70 | Pereira et al., 2021 (field crops) |
| Field pea | field-pea | 0.45 | 60–100 | Pereira et al., 2021 (field crops) |
| Flax | flax | 0.50 | 100–150 | Pereira et al., 2021 (field crops) |
| Fodder beet | fodder-beet | 0.55 | 70–120 | Hub: values for sugar beet |
| Forage sorghum | forage-sorghum | 0.55 | 100–150 | Pereira et al., 2021 (field crops) |
| French bean | green-bean | 0.45 | 50–90 | FAO-56 |
| Garlic | garlic | 0.30 | 30–50 | Pereira et al., 2021 (vegetables) |
| Grain maize | grain-maize | 0.50 | 60–150 | Pereira et al., 2021 (field crops) |
| Grain sorghum | grain-sorghum | 0.55 | 100–150 | Pereira et al., 2021 (field crops) |
| Groundnut | groundnut | 0.50 | 50–100 | Pereira et al., 2021 (field crops) |
| Lentil | lentil | 0.50 | 60–80 | Pereira et al., 2021 (field crops) |
| Lettuce | lettuce | 0.30 | 30–50 | FAO-56 |
| Lucerne (1st cut) | alfalfa-1st-cut | 0.55 | 100–200 | FAO-56 |
| Melon | melon | 0.40 | 60–120 | Pereira et al., 2021 (vegetables) |
| Oats | oats | 0.55 | 100–150 | Pereira et al., 2021 (field crops) |
| Oilseed rape | oilseed-rape | 0.50 | 80–130 | Pereira et al., 2021 (field crops) |
| Parsnip | parsnip | 0.40 | 50–100 | Pereira et al., 2021 (vegetables) |
| Pearl millet | pearl-millet | 0.55 | 100–200 | Pereira et al., 2021 (field crops) |
| Perennial ryegrass (cutting) | perennial-ryegrass-cutting | 0.60 | 60–100 | FAO-56, “Rye Grass hay” row |
| Perennial ryegrass (grazing) | perennial-ryegrass | 0.60 | 50–150 | FAO-56, “Grazing Pasture — Rotated Grazing” row |
| Perennial ryegrass (turf) | perennial-ryegrass-turf | 0.40 | 50–100 | FAO-56, “Turf grass — cool season” row |
| Potato | potato | 0.40 | 40–60 | Pereira et al., 2021 (vegetables) |
| Radish | radish | 0.30 | 30–50 | Pereira et al., 2021 (vegetables) |
| Rye | rye | 0.55 | 60–120 | Pereira et al., 2021 (field crops) |
| Safflower | safflower | 0.60 | 100–200 | Pereira et al., 2021 (field crops) |
| Sesame | sesame | 0.60 | 100–150 | Pereira et al., 2021 (field crops) |
| Silage maize | silage-maize | 0.50 | 60–150 | Pereira et al., 2021 (field crops) |
| Soya bean | soybean | 0.50 | 60–140 | Pereira et al., 2021 (field crops) |
| Spinach | spinach | 0.20 | 30–50 | Pereira et al., 2021 (vegetables) |
| Spring wheat | spring-wheat | 0.55 | 100–150 | Pereira et al., 2021 (field crops) |
| Strawberry | strawberry | 0.25 | 30–50 | Pereira et al., 2021 (vegetables) |
| Sugar beet | sugar-beet | 0.55 | 70–120 | FAO-56 |
| Sunflower | sunflower | 0.45 | 80–200 | Pereira et al., 2021 (field crops) |
| Sweet pepper | sweet-pepper | 0.30 | 50–100 | FAO-56 |
| Sweet potato | sweet-potato | 0.40 | 100–120 | Pereira et al., 2021 (vegetables) |
| Sweetcorn | sweet-corn | 0.50 | 60–150 | Pereira et al., 2021 (field crops) |
| Temporary grassland | temporary-grassland | 0.60 | 60–100 | FAO-56 |
| Tomato (open field) | tomato-open-field | 0.40 | 60–120 | Pereira et al., 2021 (vegetables) |
| Turnip | turnip | 0.50 | 50–90 | Pereira et al., 2021 (vegetables) |
| Watermelon | watermelon | 0.40 | 80–150 | Pereira et al., 2021 (vegetables) |
| Winter barley | winter-barley | 0.55 | 60–120 | Pereira et al., 2021 (field crops) |
| Winter squash | winter-squash | 0.40 | 90–150 | Pereira et al., 2021 (vegetables) |
| Winter wheat | winter-wheat | 0.55 | 100–150 | Hub |
Table 6. Depletion fraction p and rooting depth: trees, vines, small fruit and hops
| Crop | Identifier | Fraction p | Drip (cm) | Other irrigation (cm) | Sources |
|---|---|---|---|---|---|
| Almond | almond | 0.40 | 60–100 | 100–200 | 14,15 |
| Apple | apple | 0.50 | 40–90 | 100–200 | 16,17 |
| Apricot | apricot | 0.50 | 30–80 | 100–200 | 18 |
| Avocado | avocado | 0.70 | 30–60 | 50–100 | 19 |
| Cherry | cherry | 0.50 | 50–100 | 100–200 | 20 |
| Clementine | clementine | 0.50 | 30–60 | 120–150 | 21,22 |
| Fig | fig | 0.65 | 60–90 | 120–170 | 23 |
| Gold kiwifruit | gold-kiwifruit | 0.35 | 40–60 | 70–130 | 24 |
| Grapevine (table grape) | grapevine-table-grape | 0.35 | 60–100 | 100–200 | 25 |
| Grapevine (wine grape) | grapevine-wine-grape | 0.45 | 60–100 | 100–200 | 25 |
| Hazelnut | hazelnut | 0.40 | 40–60 | 100–200 | 26 |
| Highbush blueberry | highbush-blueberry | 0.50 | 30–50 | 60–120 | 27 |
| Hop | hop | 0.50 | 60–100 | 100–120 | 28 |
| Lemon | lemon | 0.50 | 30–60 | 120–150 | 21,22 |
| Olive | olive | 0.65 | 60–100 | 120–170 | 29,30,31 |
| Orange | orange | 0.50 | 30–60 | 120–150 | 21,22 |
| Peach | peach | 0.50 | 40–80 | 100–200 | 32,33 |
| Pear | pear | 0.50 | 30–90 | 100–200 | 34 |
| Persimmon | persimmon | 0.50 | 50–60 | 100–200 | 35 |
| Pistachio | pistachio | 0.40 | 90–120 | 100–150 | 36 |
| Plum | plum | 0.50 | 30–80 | 100–200 | 18 |
| Pomegranate | pomegranate | 0.65 | 60 | 120–170 | 37,38 |
| Walnut | walnut | 0.50 | 90–150 | 170–240 | 39 |
Saxton and Rawls (2006) equations used for a particle-size analysis
S = sand (%) / 100        C = clay (%) / 100        OM = organic matter (%)

θ1500t = 0.031 - 0.024 S + 0.487 C + 0.006 OM + 0.005 S×OM - 0.013 C×OM + 0.068 S×C
θWP    = θ1500t + (0.14 θ1500t - 0.02)                     wilting point (1,500 kPa)

θ33t   = 0.299 - 0.251 S + 0.195 C + 0.011 OM + 0.006 S×OM - 0.027 C×OM + 0.452 S×C
θFC    = θ33t + (1.283 θ33t² - 0.374 θ33t - 0.015)          field capacity (33 kPa)

mm of water per cm of fine earth = (θFC - θWP) × 10         water contents in m³ per m³
Table 7. Calculator examples and results
| Example | Horizons | Crop, rooting depth | TAW (mm of water) | RAW (mm of water) | RAW during a heatwave (mm of water) |
|---|---|---|---|---|---|
| Silt loam over sand | 30 cm of silt loam (USDA) over 30 cm of sand (USDA) | Other crop (p of 0.50), 60 cm | 73 | 37 | 22 |
| Clay-limestone soil, 40 cm | 40 cm of argile limoneuse (Aisne AL, tilled horizon), 30% limestone stones | Wine grape (p of 0.45), 40 cm | 50 | 22 | 12 |
| Limon moyen (Aisne), 120 cm | 30 cm of limon moyen (Aisne LM, tilled horizon) over 90 cm of limon moyen (deeper horizon) | Grain maize (p of 0.50), 120 cm | 250 | 125 | 75 |
These calculations in the hub
The hub performs the same calculation for each probe, and compares it with the measurement. In the probe settings, the soil texture is declared at each measurement depth, as a USDA class or from a particle-size analysis, organic matter included; the hub derives the water held with the equations of Saxton and Rawls. The declared crop sets the depletion fraction p and the rooting depth, with the same values as in this calculator, and a cap can limit this depth when an obstacle stops the roots higher up.
The hub then calculates TAW and RAW for the root zone (“Total reserve” and “Readily available” in its interface) and, from the soil moisture measured every hour at each depth, the root zone depletion, the share of available water remaining and the water status of the probe.
The calculator on this page goes further on four points:
- stones, according to their type;
- the Aisne triangle references;
- laboratory measurements;
- RAW during a heatwave.
Measurement shows what calculation can only estimate:
- the depth reached by an irrigation or by rain;
- the horizons in which the roots take up water;
- the rate at which soil moisture falls.
Akuasense connected multi-depth soil moisture probes, from €135 excl. VAT, measure soil moisture and temperature every 15 cm, once an hour; their measuring principle is explained in the article Capacitive Soil Moisture Sensor: How it Works. The hub brings these measurements together. The decision to irrigate remains with the farmer, who knows the field, the crop and the water resource.
Akuasense professional connected soil moisture probes are available from €135 excl. VAT.
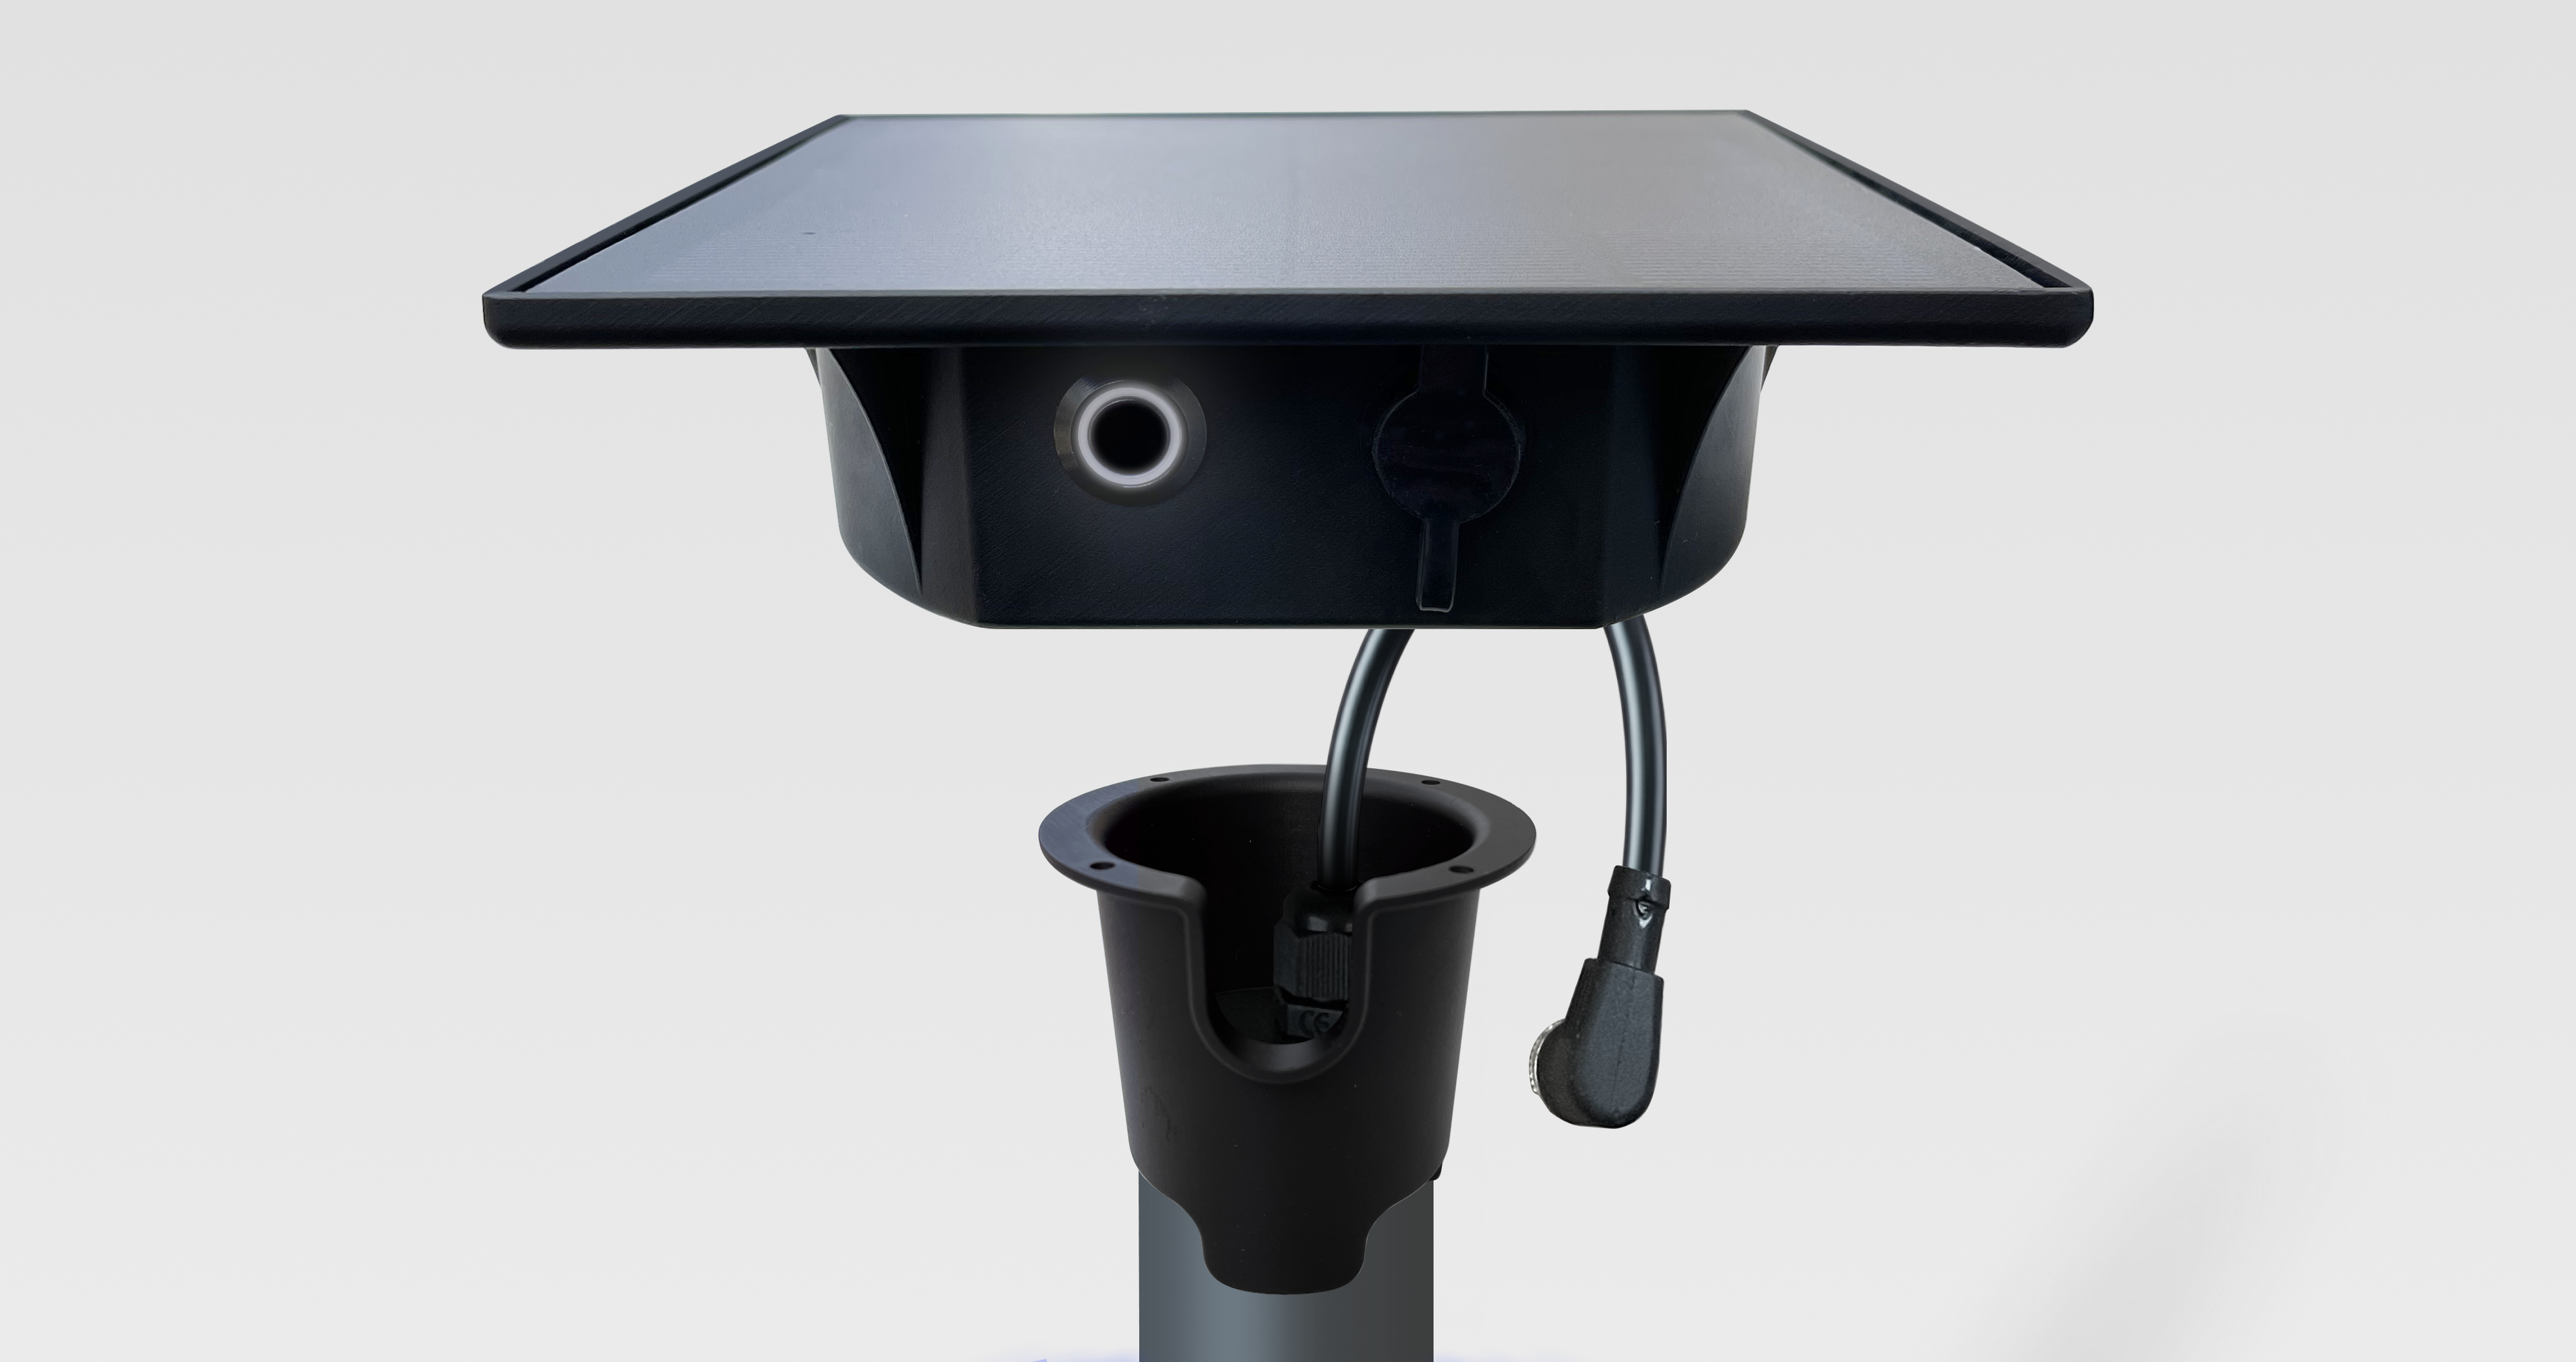
Multi‑depth capacitive soil moisture probes
One capacitive sensor every 15 cm measures volumetric soil moisture and soil temperature throughout the active root zone.
- 3 to 9 depths depending on the model: 30, 60, 90 or 120 cm
- Autonomous gateway with battery and solar panel, for up to 3 probes
- Hourly 4G transmission, SIM card and data plan included
- GPS position of each gateway within the plot
- Designed and assembled in France
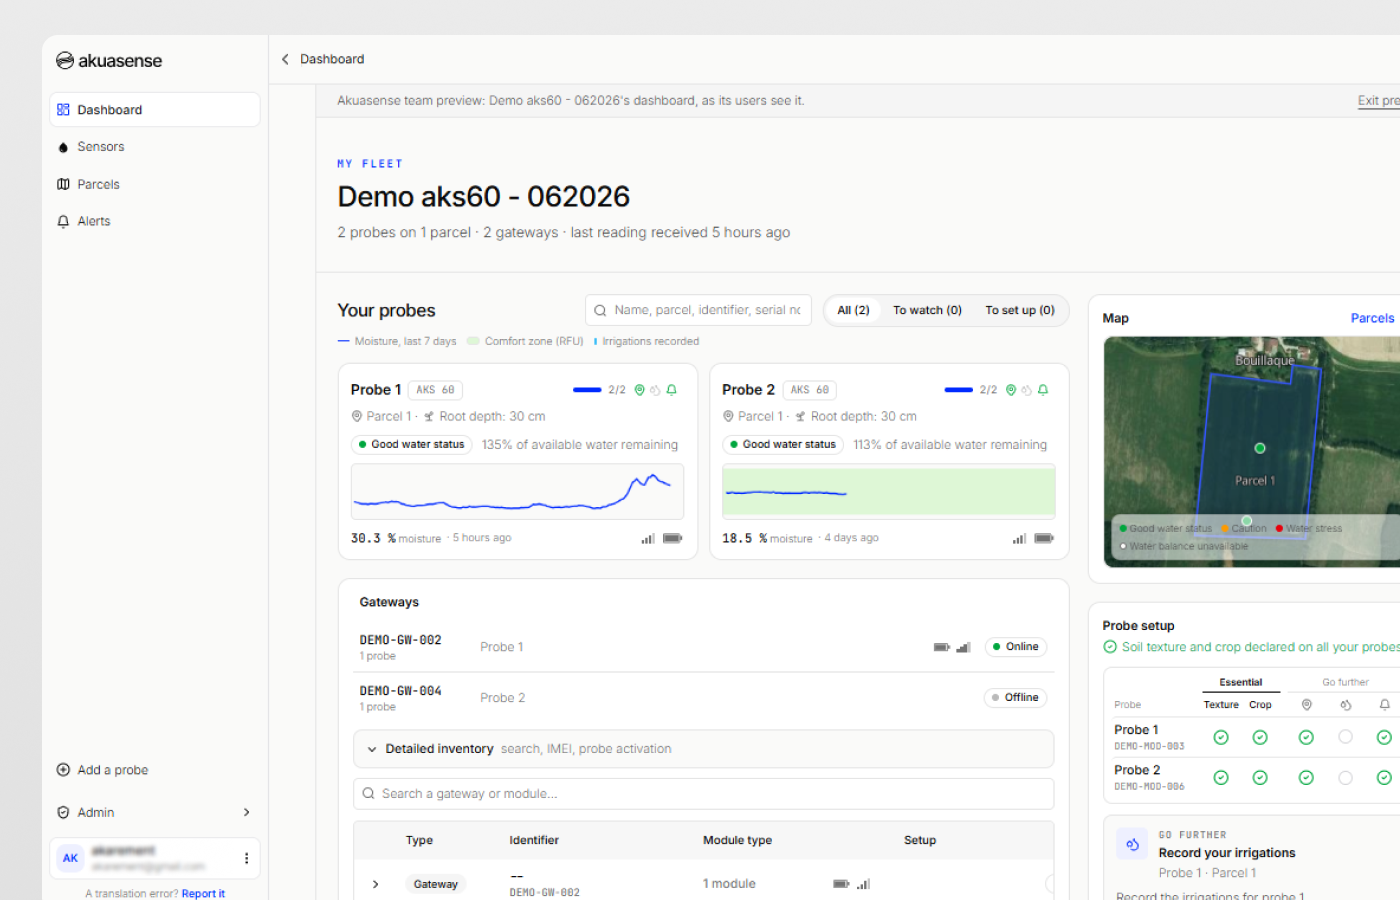
The hub: water monitoring for your plots
The hub centralises the readings of all your probes, on computer, tablet or smartphone.
- Moisture summarised over the root zone, weighted by soil and crop, in detail by depth and as a heatmap
- The water status of each probe at a glance
- Soil temperature, and the battery and signal of each gateway
- Soil texture by depth, crop, irrigation setup and irrigations, shown alongside the moisture curves
- Plot map, built-in weather and email alerts
- Your data accessible through a REST API and an MCP server
Sources
- Saxton K.E., Rawls W.J. (2006). Soil water characteristic estimates by texture and organic matter for hydrologic solutions. Soil Science Society of America Journal, 70(5), 1569-1578. doi:10.2136/sssaj2005.0117
- Bruand A., Duval O., Cousin I. (2004). Estimation des propriétés de rétention en eau des sols à partir de la base de données SOLHYDRO : une première proposition combinant le type d'horizon, sa texture et sa densité apparente [Estimating soil water retention properties from the SOLHYDRO database: a first proposal combining the type of horizon, its texture and its bulk density]. Étude et Gestion des Sols, 11(3), 323-332. afes.fr
- Bouthier A., Scheurer O., Seger M., Lagacherie P., Beaudoin N., Deschamps T., Sauter J., Fort J.-L., Cousin I. (2022). Réservoir en eau du sol utilisable par les cultures. Guide d'estimation. [Soil water reservoir available to crops: an estimation guide]. Éditions Arvalis, Paris. sols-et-territoires.org
- Allen R.G., Pereira L.S., Raes D., Smith M. (1998). Crop evapotranspiration. Guidelines for computing crop water requirements. FAO Irrigation and Drainage Paper 56, Rome. Chapters 7 and 8 (Tables 19, 20 and 22; Equations 82 to 84). fao.org
- Pereira L.S., Paredes P., Hunsaker D.J., López-Urrea R., Mohammadi Shad Z. (2021). Standard single and basal crop coefficients for field crops. Updates and advances to the FAO56 crop water requirements method. Agricultural Water Management, 243, 106466. doi:10.1016/j.agwat.2020.106466
- Pereira L.S., Paredes P., López-Urrea R., Hunsaker D.J., Mota M., Mohammadi Shad Z. (2021). Standard single and basal crop coefficients for vegetable crops, an update of FAO56 crop water requirements approach. Agricultural Water Management, 243, 106196. doi:10.1016/j.agwat.2020.106196
- Pereira L.S., Allen R.G., Paredes P., López-Urrea R., Raes D., Smith M., Kilic A., Salman M. (2025). Crop evapotranspiration. Guidelines for computing crop water requirements. Second edition, revised 2025. FAO Irrigation and Drainage Paper 56 Rev.1. FAO, Rome. Tables 6.1 and 6.2 (rooting depths). doi:10.4060/cd6621en
- Agriculture Victoria (2025). “Determining readily available water”, fact sheet, updated 22 September 2026. agriculture.vic.gov.au
- Tetegan M., Nicoullaud B., Baize D., Bouthier A., Cousin I. (2011). The contribution of rock fragments to the available water content of stony soils: proposition of new pedotransfer functions. Geoderma, 165(1), 40-49. doi:10.1016/j.geoderma.2011.07.001
- Arvalis (2026). “Maïs grain : comment gérer la conduite de parcelles suite à la canicule” [Grain maize: managing fields after the heatwave]. Terre-net, 3 August 2026. terre-net.fr
- Arvalis. “Carte des sols – Ferme de Boigneville” [Soil map of the Boigneville farm], based on Bétrémieux R., Darthout R. (1968), Étude des sols du domaine de Boigneville [Soil survey of the Boigneville farm], INRA. ecophytopic.fr
- Chambre régionale d'agriculture de Poitou-Charentes, IAAT (c. 2009). Inventaire, gestion et conservation des sols (IGCS) de Poitou-Charentes : unités de sols et objectifs de rendement [Soil inventory, management and conservation (IGCS) in Poitou-Charentes: soil units and yield targets]. Gis Sol. gissol.hub.inrae.fr
- Roman Dobarco M., Cousin I., Le Bas C., Martin M. (2019). Pedotransfer functions for predicting available water capacity in French soils, their applicability domain and associated uncertainty. Geoderma, 336, 81-95. doi:10.1016/j.geoderma.2018.08.022
- Andreu L., Hopmans J.W., Schwankl L.J. (1997). Spatial and temporal distribution of soil water balance for a drip-irrigated almond tree. Agricultural Water Management, 35(1-2), 123-146. doi:10.1016/S0378-3774(97)00018-8
- Brown P., Hopmans J., Olivos A., Sanden B. Determination of root distribution, dynamics, phenology and physiology of almonds to optimize fertigation practices. Final report, FREP 11-0461-SA. California Department of Food and Agriculture. cdfa.ca.gov
- Svoboda P., Haberle J., Moulik M., Raimanová I., Kurešová G., Mészáros M. (2023). The effect of drip irrigation on the length and distribution of apple tree roots. Horticulturae, 9(3), 405. doi:10.3390/horticulturae9030405
- Kadayıfçı A., Şenyiğit U., Dağdelen N., Öz H., Atılgan A. (2010). The effects of different irrigation methods on root distribution, intensity and effective root depth of young dwarf apple trees. African Journal of Biotechnology, 9(27), 4217-4224. core.ac.uk
- Paltineanu C., Nicolae S., Tanasescu N., Chitu E., Ancu S. (2017). Investigating root density of plum and apple trees grafted on low-vigor rootstocks to improve orchard management. Erwerbs-Obstbau, 59(1), 29-37. doi:10.1007/s10341-016-0293-7
- Kalmar D., Lahav E. (1977). Water requirements of avocado in Israel. I. Tree and soil parameters. Australian Journal of Agricultural Research, 28(5), 859-868. doi:10.1071/AR9770859
- Li P., Tan H., Wang J., Cao X., Yang P. (2019). Evaluation of water uptake and root distribution of cherry trees under different irrigation methods. Water, 11(3), 495. doi:10.3390/w11030495
- Cassiani G., Boaga J., Vanella D., Perri M.T., Consoli S. (2015). Monitoring and modelling of soil-plant interactions: the joint use of ERT, sap flow and eddy covariance data to characterize the volume of an orange tree root zone. Hydrology and Earth System Sciences, 19(5), 2213-2225. doi:10.5194/hess-19-2213-2015
- Vanella D., Ramírez-Cuesta J.M., Sacco A., Longo-Minnolo G., Cirelli G.L., Consoli S. (2021). Electrical resistivity imaging for monitoring soil water motion patterns under different drip irrigation scenarios. Irrigation Science, 39(1), 145-157. doi:10.1007/s00271-020-00699-8
- Abdolahipour M., Kamgar-Haghighi A.A., Sepaskhah A.R., Zand-Parsa S., Honar T. (2020). Root length density of rainfed fig trees under different times, amounts, and positions of supplemental irrigation. Journal of Agricultural Science and Technology, 22(4), 1137-1150. modares.ac.ir
- Calabritto M., Mininni A.N., Di Biase R., Pietrafesa A., Dichio B. (2024). Spatio-temporal dynamics of root water uptake and identification of soil moisture thresholds for precision irrigation in a Mediterranean yellow-fleshed kiwifruit orchard. Frontiers in Plant Science, 15, 1472093. doi:10.3389/fpls.2024.1472093
- Smart D.R., Schwass E., Lakso A., Morano L. (2006). Grapevine rooting patterns: a comprehensive analysis and a review. American Journal of Enology and Viticulture, 57(1), 89-104. doi:10.5344/ajev.2006.57.1.89
- Olsen J.L. (2013). Growing Hazelnuts in the Pacific Northwest: Orchard Site Selection. EM 9076. Oregon State University Extension Service. oregonstate.edu
- Bryla D.R. (2011). Crop evapotranspiration and irrigation scheduling in blueberry. Gerosa G. (ed.), Evapotranspiration – From Measurements to Agricultural and Environmental Applications, InTech. doi:10.5772/18311
- Stampfl J., Fuß S., Münsterer J., Portner J., Schlagenhaufer A. (2021). Tropfbewässerung und Fertigation bei Hopfen. LfL-Information. Bayerische Landesanstalt für Landwirtschaft. lfl.bayern.de
- Searles P.S., Saravia D.A., Rousseaux M.C. (2009). Root length density and soil water distribution in drip-irrigated olive orchards in Argentina under arid conditions. Crop & Pasture Science, 60(3), 280-288. doi:10.1071/CP08135
- Fernández J.E., Moreno F., Cabrera F., Arrue J.L., Martín-Aranda J. (1991). Drip irrigation, soil characteristics and the root distribution and root activity of olive trees. Plant and Soil, 133(2), 239-251. doi:10.1007/BF00009196
- Gómez-del-Campo M. (2013). Summer deficit-irrigation strategies in a hedgerow olive orchard cv. 'Arbequina': effect on fruit characteristics and yield. Irrigation Science, 31(3), 259-269. doi:10.1007/s00271-011-0299-8
- Bryla D.R., Dickson E., Shenk R., Johnson R.S., Crisosto C.H., Trout T.J. (2005). Influence of irrigation method and scheduling on patterns of soil and tree water status and its relation to yield and fruit quality in peach. HortScience, 40(7), 2118-2124. doi:10.21273/HORTSCI.40.7.2118
- Conesa M.R., Conejero W., Vera J., Ruiz-Sánchez M.C. (2023). Assessment of trunk microtensiometer as a novel biosensor to continuously monitor plant water status in nectarine trees. Frontiers in Plant Science, 14, 1123045. doi:10.3389/fpls.2023.1123045
- Janssens P., Diels J., Vanderborght J., et al. (2015). Numerical calculation of soil water potential in an irrigated 'conference' pear orchard. Agricultural Water Management, 148, 113-122. doi:10.1016/j.agwat.2014.09.023
- Porras-Jorge R., Aguilar J.M., Baixauli C., Pascual B., Pascual-Seva N. (2025). Effect of deficit irrigation on agronomic and physiological performance of young persimmon (Diospyros kaki Thunb.) trees. Agronomy, 15(7), 1671. doi:10.3390/agronomy15071671
- Culumber M., Zaccaria D. (2021). 2021 Pistachio Irrigation: Mitigation Strategies for Drought. University of California Cooperative Extension. ucanr.edu
- Buesa I., Badal E., Guerra D., et al. (2012). Development of an irrigation scheduling recommendation for pomegranate trees (Punica granatum). Options Méditerranéennes, Série A, 103, 141-145, CIHEAM. ciheam.org
- Hiwale S.S., More T.A., Bagle B.G. (2011). Root distribution pattern in pomegranate 'Ganesh' (Punica granatum L.). Acta Horticulturae, 890, 323-326. doi:10.17660/ActaHortic.2011.890.44
- Beede R.H., Fulton A.E. Irrigation Scheduling for Walnuts. University of California Cooperative Extension. ucanr.edu
This calculator comes from the article Should you refill the soil’s available water before summer?, which offers three other tools: an irrigation capacity calculator, a wetted depth calculator and a seasonal soil water balance simulator.