Tensiometric or capacitive probe: which to choose for irrigation?
 Akuasense
A tensiometric probe and a capacitive probe do not measure the same quantity. The tensiometric probe, such as a tensiometer or a Watermark probe, measures soil water tension, that is, the force with which the soil holds its water: it indicates when to irrigate, based on thresholds published in kPa for many crops. The capacitive probe measures the soil’s water content, that is, the amount of water present: installed at several depths, it also indicates how much water to apply and how deep the water goes. The choice depends on what you want to know, the soil type and the number of depths to monitor, and the two measurements can complement each other.
The tensiometric probe is the long-established tool for monitoring soil water, and many farmers schedule their irrigation with Watermark probes. The multi-depth capacitive probe measures a different quantity, water content, at several depths at once. This article compares the two technologies: what each one measures, how they work, their limitations depending on the soil type, the price of a connected monitoring site and the benefit of combining them. It also provides a converter for moving from a tension to a water content, depending on the soil type.
What do a tensiometric probe and a capacitive probe measure?
The two families of probes do not measure the same quantity: the tensiometric probe measures the force with which the soil holds its water, the capacitive probe the amount of water it contains. This section defines these two quantities, then the soil water retention curve that links them according to the soil type, and provides a converter for moving from one to the other.
Soil water tension, in kilopascals or centibars
Soil holds its water in its pores and around its particles. As the soil dries, the remaining water is held more strongly, and roots must make an increasing effort to extract it3. Soil water tension measures this holding force. A tensiometric probe expresses this tension in kilopascals (kPa) or in centibars, two units of equal value: the tension is 0 kPa in a saturated soil and increases as the soil dries. Tension thus describes how strongly the water is held, and water content how much water is present1.
Tension gives direct information on the effort the crop makes to take up water, and depends less on the soil type than water content does10. The main strength of the tensiometric probe lies in this direct reading: irrigation thresholds are published in kPa for many crops (section 3).
Soil water content (VWC), in % vol. and then in millimetres
Volumetric water content, or volumetric soil moisture (VWC), is the share of the soil volume occupied by water2. A capacitive probe measures water content in % vol. Multiplied by the thickness of the soil concerned, water content gives an amount of water in millimetres, the unit of rainfall and irrigation amounts: a water content of 1% vol. over 10 cm of soil represents 1 mm of water3. With sensors at several depths, a capacitive probe thus gives the water stored in the whole root zone, and the amount of water needed to replenish it.
Washington State University regards this difference as essential: a water content probe indicates when to irrigate and how much water to apply, a tensiometric probe only when to irrigate11.
The soil water retention curve, which links tension to water content
Tension and water content are linked by the soil water retention curve, which is specific to each soil4. A sandy soil, with large pores, releases its water at low tension; a clay soil, with fine pores, holds its water more strongly. At the same tension, a coarse-textured soil therefore holds less water than a fine-textured soil12.
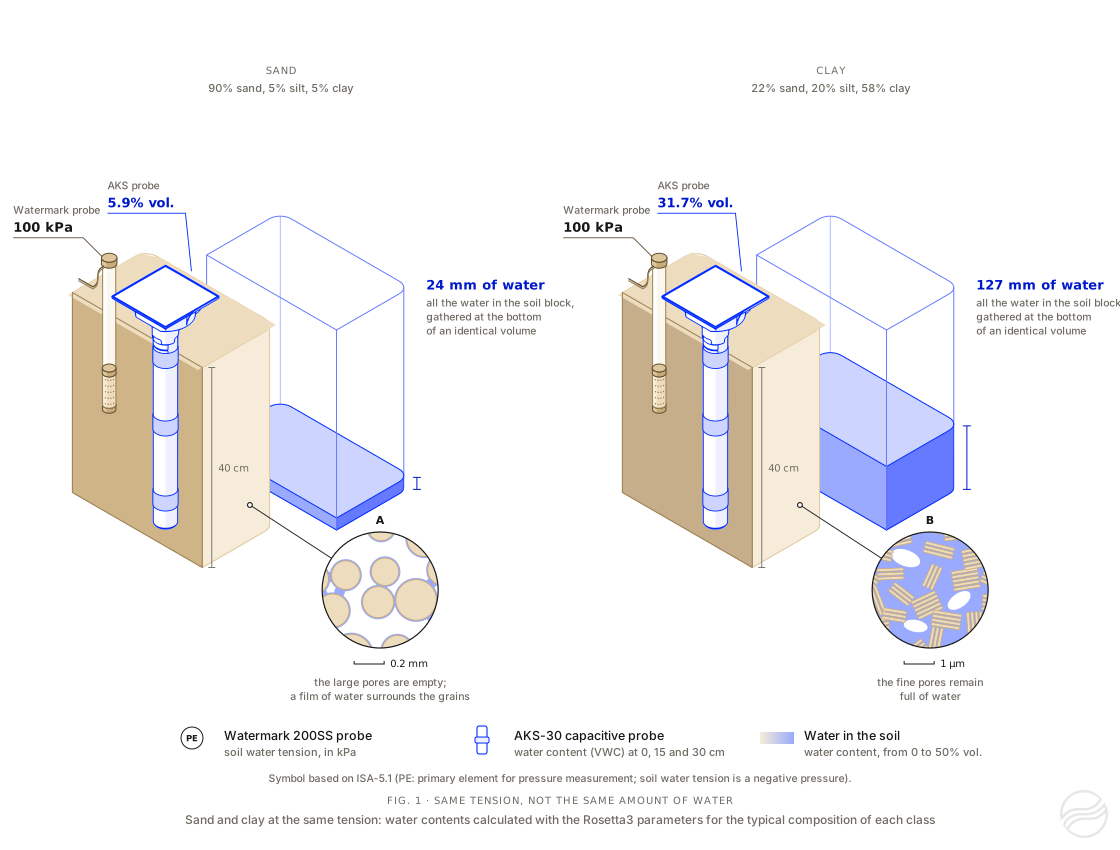
Figure 1. At the same tension of 100 kPa, a sand and a clay do not hold the same amount of water. Water contents calculated with the van Genuchten equation and the Rosetta3 parameters for the typical composition of each texture class.
The retention curve is commonly described by the van Genuchten equation13. The Rosetta3 program estimates its parameters from the soil texture14. Applied to each of the 12 texture classes of the United States Department of Agriculture5, taken at its typical composition, the equation gives the following water contents at 100 kPa: about 5.9% vol. for a sand, 22.1% vol. for a loam and 31.7% vol. for a clay. Over 30 cm of soil, these water contents represent 18, 66 and 95 mm of water respectively; over the 40 cm of the blocks in Figure 1, 24 mm for the sand and 127 mm for the clay.
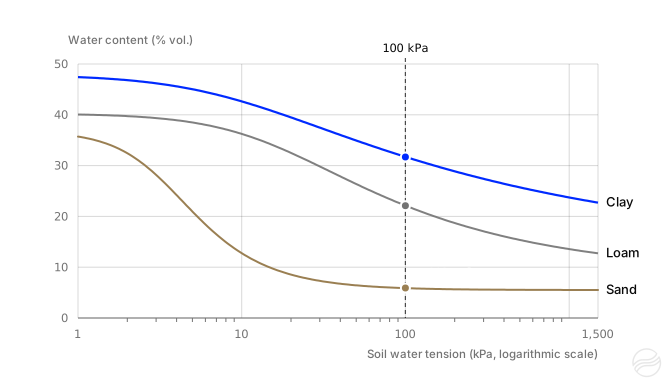
Figure 2. Water content of three texture classes as a function of soil water tension: sand, loam and clay. Curves calculated with the van Genuchten equation and the parameters that the Rosetta3 program gives for the typical composition of each class, as used by the converter.
A tension reading alone therefore does not give the irrigation amount: to convert a tension threshold into an amount of water to apply, the soil water retention curve must be known15. The converter below applies this relationship to the main soil types.
Choose the texture class of your soil, then enter a tension to get the corresponding water content, in % vol. and in mm, or the reverse, and the water needed to bring the soil back to field capacity.
The link is incomplete or contains a value out of range: the default example is shown.
Typical composition: 41% sand, 41% silt and 18% clay. Choose the class closest to your soil analysis.
Direction of the calculation
1 kPa = 1 centibar. A Watermark probe reads up to 239 kPa; the calculation goes up to 1,500 kPa, the tension used for the wilting point.
From 8.5 to 40.3% vol. for a loam.
The soil thickness the reading represents, for example 30 cm around a probe. The calculation assumes the same tension throughout this thickness.
Run the conversion to get the result with your settings.
Water content (VWC)
22.1% vol.
at a tension of 100 kPa in a loam
Amount of water
66mm of water
in the 30 cm of soil, of which 28 mm above the wilting point
Up to field capacity
22mm of water
water needed in the 30 cm of soil (field capacity of the loam: 29.2% vol.)
At the same tension, a sand would hold 5.9% vol. of water and a clay 31.7% vol.
Receive this conversion by email
A summary of this conversion and a link to reopen it, sent to your inbox.
If it has not arrived within a few minutes, please check your spam folder.
Thank you for your feedback.
It helps us improve this converter.
The method and parameters of the converter
The van Genuchten equation gives the water content at the tension , expressed in centimetres of water column (1 kPa = 10.197 cm):
is the residual water content, the saturated water content, and and are two shape parameters of the curve. The amount of water in mm is the water content, rounded to one decimal place in % vol., multiplied by the soil thickness. The converter calculates the amount of water at field capacity and at the wilting point in the same way: the water above the wilting point and the water needed to return to field capacity are the differences between these amounts of water.
| Texture class | Sand / silt / clay (%) | (cm³/cm³) | (cm³/cm³) | ( in 1/cm) | Field capacity (% vol.) | Wilting point (% vol.) | |
|---|---|---|---|---|---|---|---|
| Sand | 90 / 5 / 5 | 0.0550 | 0.3674 | −1.5368 | 0.3622 | 12.8 | 5.5 |
| Loamy sand | 82 / 10 / 8 | 0.0596 | 0.3727 | −1.6130 | 0.2256 | 13.3 | 6.5 |
| Sandy loam | 66 / 22 / 12 | 0.0674 | 0.3819 | −1.7713 | 0.1538 | 21.4 | 9.7 |
| Loam | 41 / 41 / 18 | 0.0840 | 0.4026 | −2.1824 | 0.1561 | 29.2 | 12.7 |
| Silt loam | 20 / 65 / 15 | 0.0792 | 0.4297 | −2.4573 | 0.1891 | 34.1 | 11.9 |
| Silt | 8 / 87 / 5 | 0.0640 | 0.4537 | −2.4273 | 0.2169 | 33.8 | 9.2 |
| Sandy clay loam | 60 / 13 / 27 | 0.0991 | 0.3845 | −1.8250 | 0.1192 | 26.6 | 15.0 |
| Clay loam | 31 / 34 / 35 | 0.1144 | 0.4268 | −2.1116 | 0.1266 | 32.7 | 17.6 |
| Silty clay loam | 10 / 56 / 34 | 0.1133 | 0.4609 | −2.3029 | 0.1469 | 36.5 | 17.4 |
| Sandy clay | 51 / 6 / 43 | 0.1211 | 0.4073 | −1.8221 | 0.0954 | 30.9 | 19.6 |
| Silty clay | 6 / 47 / 47 | 0.1236 | 0.4940 | −2.1531 | 0.1235 | 38.4 | 20.3 |
| Clay | 22 / 20 / 58 | 0.1289 | 0.4791 | −1.9165 | 0.0946 | 37.0 | 22.7 |
Typical composition: the proportions of sand, silt and clay chosen by Akuasense to represent each class. Parameters estimated by Rosetta314 for this composition. Field capacity at 33 kPa, and at 10 kPa for sand; permanent wilting point at 1,500 kPa.
The calculation link. The page URL accepts the following parameters, common to all languages. The link that the converter copies or sends contains all of them: opened in a browser, it displays the same conversion. These parameters also allow an AI assistant to build the link to a conversion.
texture: identifier of the texture class,sand,loamy-sand,sandy-loam,loam,silt-loam,silt,sandy-clay-loam,clay-loam,silty-clay-loam,sandy-clay,silty-clayorclay;dir: direction of the calculation,tensionto go from a tension to a water content,vwcfor the reverse;kpa, withdir=tension: tension, in kPa, whole number from 0 to 1500;vwc, withdir=vwc: water content, in % vol., to one decimal place, between the residual water content and the saturated water content of the class (table above);depth: soil thickness, in cm, multiple of 5 between 5 and 200;unit(optional): unit of the chart,vwc(default) ormm;scale(optional): tension scale of the chart,log(default) orlin.
texture, dir, depth and, depending on the direction, kpa or vwc are required; decimals are written with a point, and each parameter may appear only once. Other URL parameters are ignored. An incomplete link, or one with a value outside these limits, displays the default example with a message.
Example: https://akuasense.com/en/blog/tensiometric-vs-capacitive-probe/?texture=loam&dir=tension&kpa=100&depth=30#tool-tension-water-content converts a tension of 100 kPa in a loam, over 30 cm of soil; the converter displays a water content of 22.1% vol., i.e. 66 mm of water (open in the converter).
How do a tensiometric probe and a capacitive probe work?
The two technologies rely on different physical principles. This section describes the two forms of tensiometric probe, the tensiometer and the Watermark 200SS probe, then the multi-depth capacitive probe, and compares how each is installed at a monitoring site.
The tensiometer and its porous ceramic cup
The tensiometer is the original form of tensiometric probe: a water-filled tube, closed at its base by a porous ceramic cup in contact with the soil. As the soil dries, the water in the tube is drawn out through the cup, and the vacuum created in the tube, read by a vacuum gauge or a pressure transducer, equals the soil water tension. The tube must remain full of water and free of air bubbles1, and the tensiometer is removed over winter, because frost can crack the cup16. The tensiometer suits crops kept relatively wet, such as cool-season vegetables (lettuce, celery, cabbage); under trees, vines and arable crops, which are irrigated at drier levels, soil tension can exceed its measuring range10.
The Watermark 200SS probe and its granular matrix
The Watermark 200SS probe, made by the American company Irrometer, is one of the best-known tensiometric probes in agriculture17. Two electrodes are embedded in a granular matrix whose water equilibrates with that of the soil; the electrical resistance between the electrodes varies with tension8. A reading device converts this resistance into tension: up to 239 kPa for models that record the readings8. The conversion depends on soil temperature18. The Watermark 200SS probe needs no refilling and stays in place all season.
The multi-depth capacitive probe
A capacitive probe measures the dielectric permittivity of the soil, a physical quantity that is very low for air, low for soil minerals and very high for water. This contrast makes the measurement highly sensitive to the amount of water. For AKS probes, the water content is derived from the permittivity using the relationship established by Topp and colleagues9. The measuring principle is explained in the article Capacitive soil moisture sensor: how it works.
Akuasense’s AKS capacitive probes, for example, have a sensor every 15 cm, over 30 to 120 cm depending on the model, i.e. 3 to 9 depths, and measure soil moisture and temperature at each of these depths. Each sensor is individually calibrated in the workshop, to an accuracy of ±1.5% vol. A connected 4G gateway, powered by a solar panel, sends the readings every hour to the hub, the web app for Akuasense connected soil moisture probes.
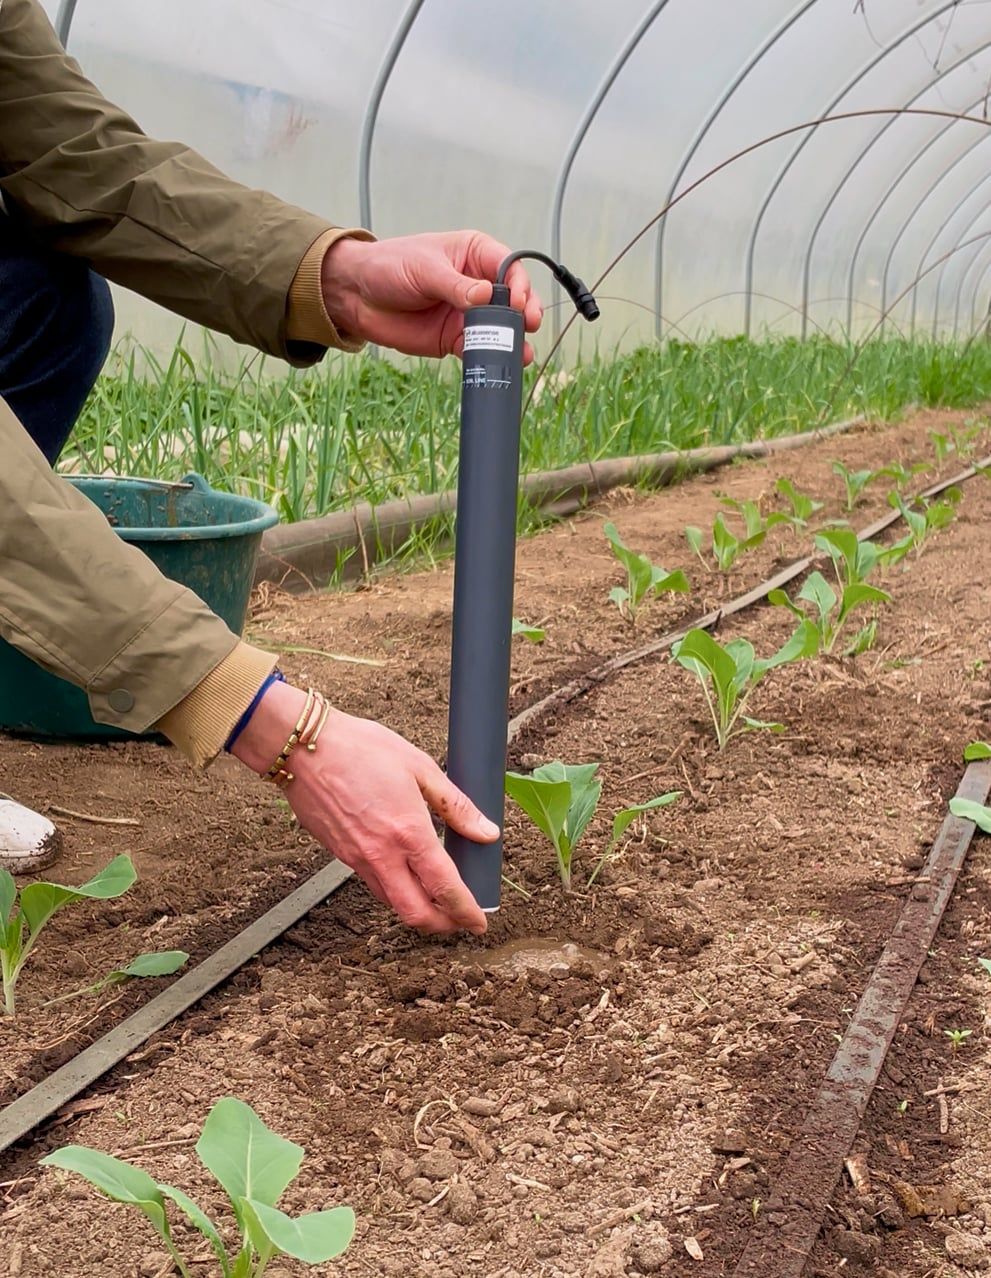
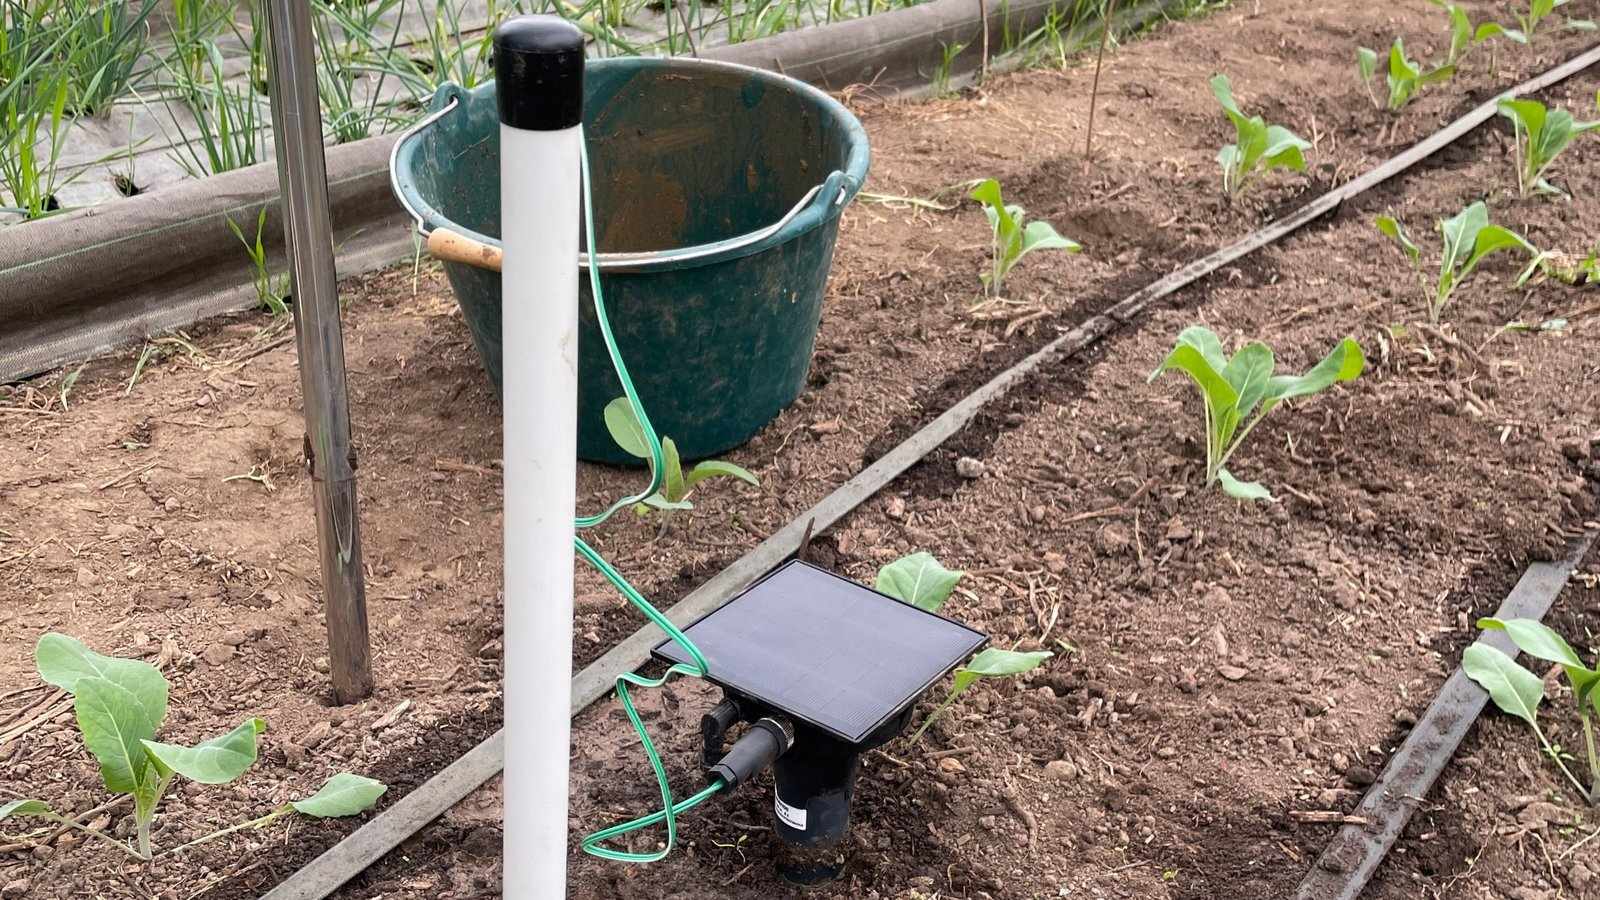
An AKS-30 capacitive probe being installed in a vegetable polytunnel: the tube is inserted vertically into the hole prepared with an auger. Photo: Akuasense.
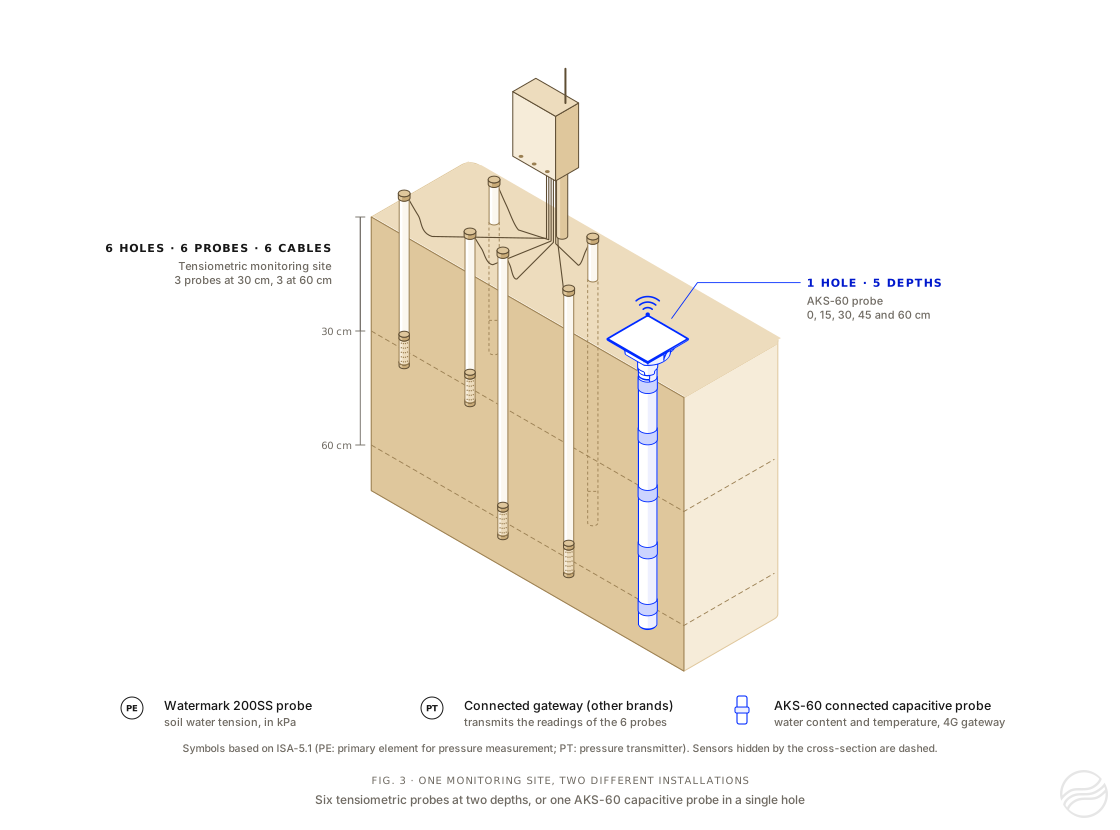
Figure 3. To monitor a 60 cm root zone, a tensiometric monitoring site often has 6 probes, at 2 depths. An AKS-60 capacitive probe measures 5 depths in a single hole, with its connected 4G gateway.
Comparing the two technologies, criterion by criterion
Five criteria distinguish the two technologies in the field: the measuring range and accuracy, the influence of the soil type, the depths monitored, installation and maintenance, and the reading of the measurements to trigger irrigation. For each one, the tensiometric probe and the capacitive probe are set side by side; a table summarises them all at the end of this section.
Measuring range and accuracy
Tensiometric probe
Its measuring range is limited, and readings vary from one probe to another.
The tensiometer stops working above 70 to 85 kPa, as air can then enter the water column and distort the reading1. The Watermark 200SS probe measures up to 239 kPa, but two probes installed in the same soil give different readings: for the Watermark Model 200, a reference study estimates that 3 to 6 probes per depth are needed to determine the tension to within 10%, with 90% confidence19. When the soil dries quickly, the Watermark probe also lags well behind the actual tension, as a greenhouse trial in Almería on drip-irrigated sweet pepper and melon showed20.
Capacitive probe
It measures water content from dry soil up to saturation.
A capacitive probe measures water content from dry soil up to saturation, at each of its depths. Its signal comes mainly from the few centimetres of soil surrounding the tube: the quality of the measurement therefore depends above all on the contact between the tube and the soil, that is, on the care taken during installation21.
Influence of the soil type
Tensiometric probe
In sandy soil, the Watermark probe responds poorly to low tensions; in stony soil, tensiometers are unsuitable.
In sandy soils, the Watermark 200SS probe is poor at resolving low tensions: in a study of two sandy soils, a fine sand and a loamy fine sand, it did not respond to tension changes below about 10 kPa, whereas the irrigation thresholds for these soils are often around 10 kPa22. In stony and gravelly soils, tensiometers are unsuitable21.
Capacitive probe
It measures in sandy soil and gives the water stored directly; in stony soil, its installation requires care.
A capacitive probe measures water content across the whole moisture range, sands included, and gives the water stored in mm without going through a retention curve. The soil texture sets the field capacity and the wilting point at each depth, and hence TAW and RAW. In a stony soil, the stones in contact with the sensor are removed during installation, to avoid air gaps21.
Depths monitored
Tensiometric probe
A probe measures only one depth: a monitoring site often has 6.
Monitoring several depths requires several tensiometric probes23; yet, for a deep-rooted crop, several measurements spread over the whole root zone are desirable21. As the probes must also be replicated at each depth to smooth out their differences19, a tensiometric monitoring site often has 6 probes. In France, the chambres d’agriculture (public bodies governed by elected representatives of the farming sector, which advise farmers in each département) recommend at least 6 probes per monitored field for arable crops, 3 at 30 cm and 3 at 60 cm17,24. The analysis is based on the median of the readings17.
Installation and maintenance
Tensiometric probe
One probe is needed per depth monitored, and the tensiometer requires regular maintenance.
Capacitive probe
It is installed in a single hole and can move to another field from one season to the next.
A multi-depth capacitive probe is installed vertically, in a single hole drilled with an auger to the diameter of the tube, and stays in place all season. It can be removed at the end of the season and reinstalled in another field.
Irrigation thresholds and reading the curves
Tensiometric probe
Irrigation starts when the tension exceeds a threshold specific to the crop and the soil.
Tension-based irrigation thresholds vary with the crop, its growth stage, the climate, the soil type and the measurement depth25. For example, for a Watermark probe, the University of Nebraska gives thresholds of 20 to 25 kPa in fine sand and 75 to 110 kPa in silt loam, calculated for a 35% depletion of the total available water8. The table below gives reference values for several groups of crops.
Capacitive probe
Readings show the water stored relative to TAW and RAW.
With a capacitive probe, TAW and RAW, calculated from the soil texture and the crop, position each soil moisture curve between field capacity and water stress. For AKS probes, the hub makes this calculation for each probe.
Reference tension thresholds for triggering irrigation
| Crop | Irrigation threshold (kPa) |
|---|---|
| Cereals (small grains) | 40 to 50 at the vegetative stage, 70 to 80 at ripening |
| Potato | 30 to 50 |
| Lettuce | 40 to 60 |
| Onion | 45 to 65 |
| Tomato | 60 to 150 |
| Deciduous fruit trees | 50 to 80 |
| Citrus | 50 to 70 |
| Grapevine | 40 to 50 early in the season, 100 at ripening |
Values established by Taylor (1965) and reproduced by the University of California25. The lower values apply to hot, dry climates and the higher values to cool, humid climates; they also vary with the soil type and the measurement depth.
Comparison table: tensiometric probe and capacitive probe
| Criterion | Tensiometric probe (Watermark 200SS) | Multi-depth capacitive probe |
|---|---|---|
| Quantity measured | Soil water tension (kPa) | Water content (% vol.) and, depending on the model, temperature |
| What the measurement tells you | When to irrigate | When to irrigate, how much to apply, how deep the water goes |
| Depths per probe | 1 | 2 to 12 depending on the model (3 to 9 for AKS probes) |
| Probes per monitoring site | Often 6, at 2 depths | 1 |
| Measuring range | 0 to 239 kPa; limited response below 10 kPa in sandy soil | From dry soil to saturation |
| Reading | Thresholds in kPa by crop | Water stored in mm, TAW and RAW according to the soil texture and the crop |
| Price as a connected system | €330 to €524 excl. VAT per probe (1 depth); €1,270 to €1,650 excl. VAT for 6 probes (2 depths) | €574 to €2,542 excl. VAT on the market; AKS probes: €135 to €265 excl. VAT, 4G gateway included |
How much does a connected tensiometric probe cost?
A tensiometric probe transmits nothing on its own: it has to be read, by hand or by a connected gateway. The prices below were recorded on 14 November 2026 on the websites of manufacturers and distributors or, failing that, in their latest published price list. Prices exclude VAT, and each range covers at least two offers. Three like-for-like comparisons set market prices against those of Akuasense probes: a connected Watermark probe, a monitoring site covering 60 cm, then capacitive probes from 30 to 120 cm.
The price of a Watermark 200SS probe and of reading it
A Watermark 200SS probe on its own costs €40 to €62 excl. VAT from French agricultural distributors, without a reader or data transmission. A handheld reader costs €290 to €325 excl. VAT, and a kit of 6 probes with a reader €585 to €710 excl. VAT. Readings are then taken by hand, in the field, twice a week or more8.
A connected Watermark probe: another brand’s gateway or the AKS 4G gateway
The connected gateways sold for tensiometric probes cost €141 to €890 excl. VAT, without the probes. The cheapest transmit over a LoRa or LoRaWAN radio network and also require a LoRa gateway, costing €154 to €480 excl. VAT. A ready-to-install connected set with one tensiometric probe costs €330 to €524 excl. VAT, excluding the LoRa gateway.
The AKS connected 4G gateway costs €115 excl. VAT and transmits directly over the mobile network, with no need for a LoRa gateway. It has a dedicated input for a Watermark 200SS probe, which Akuasense supplies mounted on a PVC sleeve, for €85 excl. VAT. Without an AKS probe, the gateway clips onto a steel tube 1 m long and 40 mm in diameter, driven 50 cm into the ground: the gateway then sits 50 cm above the ground, and the probe’s 1.5 m cable reaches it without an extension. Akuasense supplies this tube for €35 excl. VAT; a tube of the same diameter bought elsewhere is also suitable. Including the probe and the tube, a connected Watermark probe thus comes to €235 excl. VAT. The Watermark probe and the tube are not yet available in the online shop: contact us.
When an AKS probe is connected to the same gateway, the hub corrects the reading of the Watermark probe for the soil temperature measured by the AKS probe (section 6).
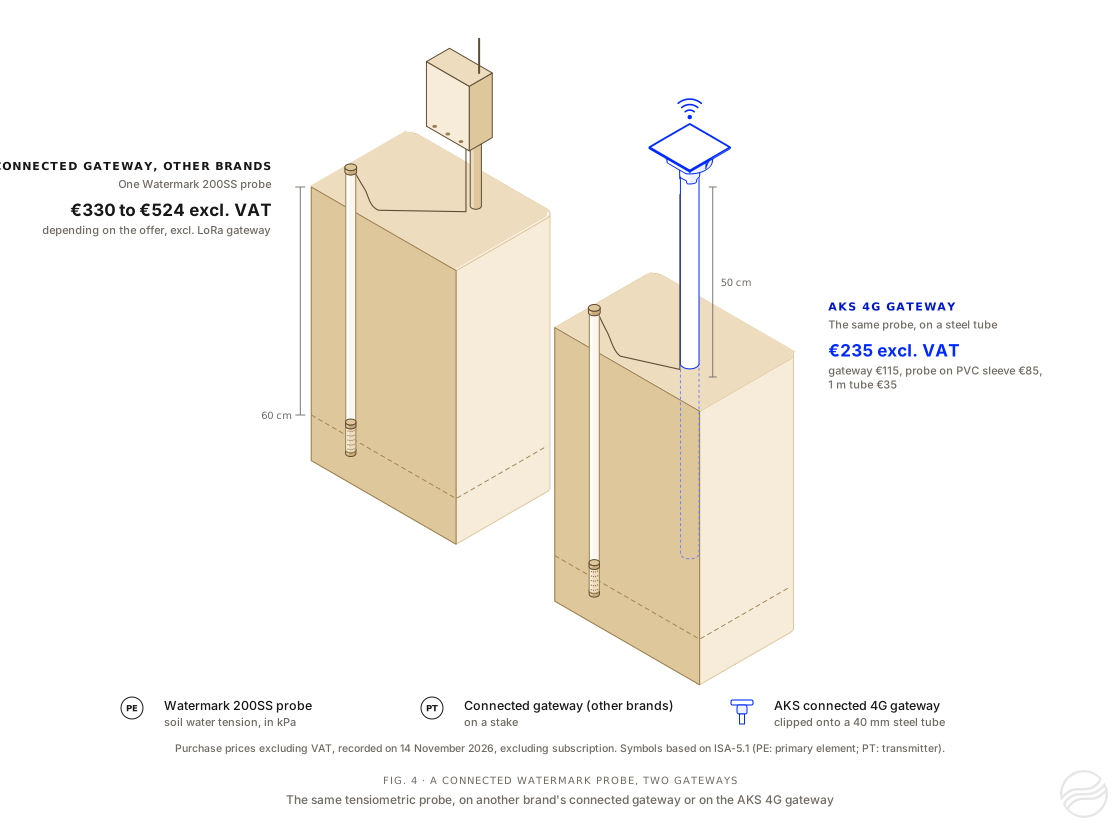
Figure 4. The same Watermark 200SS probe, connected by another brand’s gateway or by the AKS 4G gateway mounted on a steel tube. Purchase prices excluding VAT recorded on 14 November 2026, excluding subscription.
A monitoring site covering 60 cm: 6 tensiometric probes or one AKS-60 probe
A tensiometric probe measures a single depth, and two neighbouring probes give different readings. France’s chambres d’agriculture therefore recommend at least 6 probes per monitored field, 3 at 30 cm and 3 at 60 cm17,24. As a connected set, these 6 probes cost €1,270 to €1,650 excl. VAT and measure 2 depths. An AKS-60 probe, 4G gateway included, measures 5 depths in a single hole for €165 excl. VAT: this is the comparison shown in Figure 3.
From 30 to 120 cm: connected capacitive probes
Gateway included, the connected multi-depth capacitive probes on the market cost €574 to €1,440 excl. VAT in lengths of 30 to 40 cm, for 2 to 3 depths, €649 to €2,542 excl. VAT in lengths of 60 to 70 cm, for 2 to 6 depths, and €724 to €2,136 excl. VAT in lengths of 90 to 120 cm, for 6 to 12 depths. These ranges include every offer with a public price that was recorded, some of which are sold only in the United States or Australia; their prices are converted into euros at the European Central Bank rate of 13 November 2026. AKS probes cover 30 to 120 cm, with a moisture and temperature sensor every 15 cm: from the AKS-30, 3 depths for €135 excl. VAT, to the AKS-120, 9 depths for €265 excl. VAT, 4G gateway included.
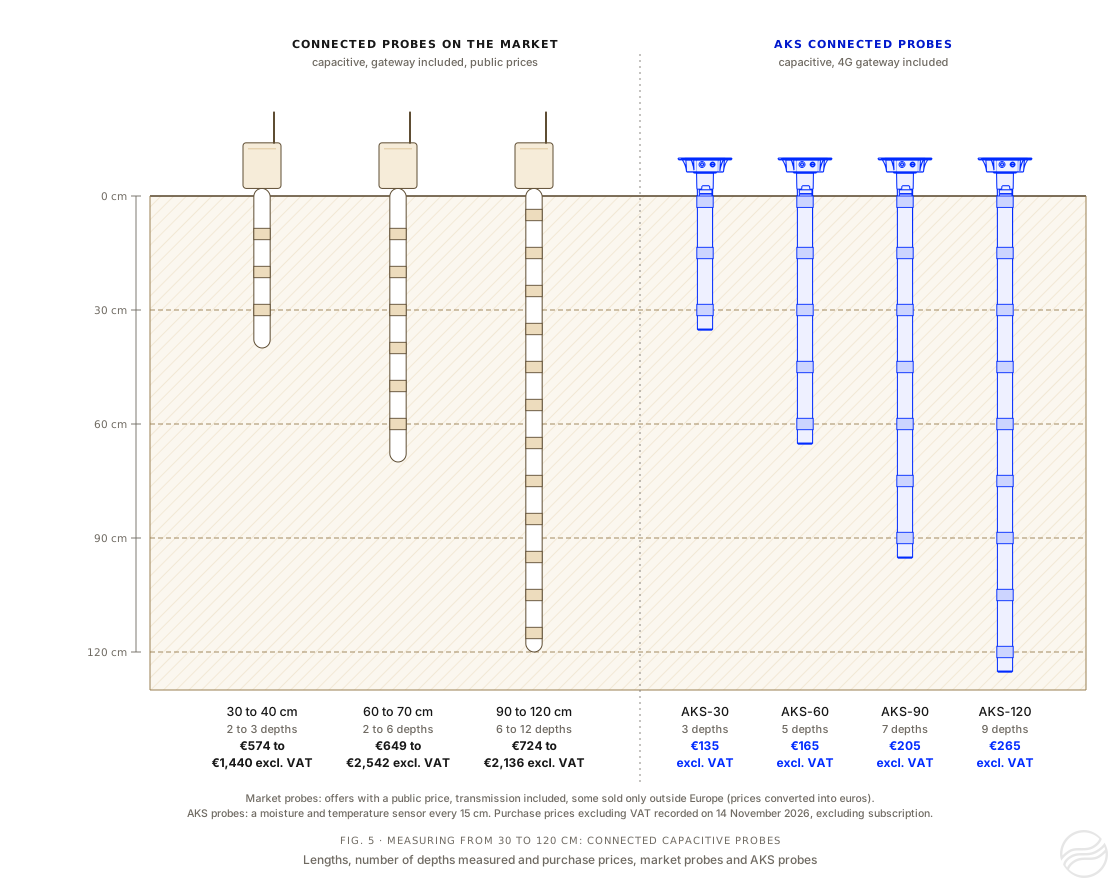
Figure 5. Connected capacitive probes from 30 to 120 cm: length, number of depths measured and purchase price excluding VAT, recorded on 14 November 2026, excluding subscription. Some market offers are sold only in the United States or Australia; their prices are converted into euros.
The three comparisons in one table
The following table brings together the three comparisons in this section: for each configuration, the depths measured, the quantities monitored, the transmission method and the purchase price.
| Configuration | Depth covered | Number of depths | Water content | Soil temperature | Direct 4G, no LoRa gateway | SIM and data plan included | Purchase price |
|---|---|---|---|---|---|---|---|
| 1 · A connected Watermark probe | |||||||
| Watermark 200SS on another brand's connected gateway | single point | 1 | varies by offer | varies by offer | varies by offer | €330 to €524 excl. VAT | |
| Watermark 200SS on the AKS 4G gateway 1 m steel tube | single point | 1 | €235 excl. VAT Contact us | ||||
| 2 · A monitoring site covering 60 cm | |||||||
| 6 Watermark probes on another brand's connected gateway 3 at 30 cm, 3 at 60 cm | 60 cm | 2 | varies by offer | varies by offer | varies by offer | €1,270 to €1,650 excl. VAT | |
| AKS-60 capacitive probe | 60 cm | 5 | €165 excl. VAT Buy now | ||||
| 3 · A capacitive probe, from 30 to 120 cm | |||||||
| Connected capacitive probes on the market including offers sold outside Europe | 30 to 120 cm | 2 to 12 | varies by offer | varies by offer | varies by offer | €574 to €2,542 excl. VAT | |
| AKS-30 to AKS-120 capacitive probes | 30 to 120 cm | 3 to 9 | €135 to €265 excl. VAT Buy now | ||||
“Varies by offer”: the feature varies from one market offer to another. Purchase prices excluding VAT recorded on 14 November 2026, excluding subscription and, for LoRa and LoRaWAN tensiometric probe sets, excluding the LoRa gateway. Prices of offers sold outside Europe converted into euros. The hub subscription costs from €2 excl. VAT per probe per month, SIM card and 4G data plan included.
Prices recorded on 14 November 2026
| Configuration | Purchase price |
|---|---|
| Watermark 200SS probe on its own, without a reader or data transmission | €40 to €62 excl. VAT |
| Handheld reader | €290 to €325 excl. VAT |
| Manual reading kit: reader and 6 Watermark probes | €585 to €710 excl. VAT |
| Connected gateway for tensiometric probes, without probe | €141 to €890 excl. VAT |
| LoRa gateway required by LoRa and LoRaWAN systems | €154 to €480 excl. VAT |
| Connected set on the market, 1 tensiometric probe, excluding the LoRa gateway | €330 to €524 excl. VAT |
| Connected set on the market, 6 Watermark probes | €1,270 to €1,650 excl. VAT |
| Connected capacitive probe on the market, 30 to 40 cm | €574 to €1,440 excl. VAT |
| Connected capacitive probe on the market, 60 to 70 cm | €649 to €2,542 excl. VAT |
| Connected capacitive probe on the market, 90 to 120 cm | €724 to €2,136 excl. VAT |
| AKS connected 4G gateway (no LoRa gateway needed) | €115 excl. VAT |
| Watermark 200SS probe mounted on a PVC sleeve, supplied by Akuasense (on request) | €85 excl. VAT |
| Steel tube, 1 m long and 40 mm in diameter, to mount the gateway (on request) | €35 excl. VAT |
| Watermark 200SS probe on the AKS 4G gateway, tube included | €235 excl. VAT |
| AKS-30 kit: capacitive probe with 3 depths and 4G gateway | €135 excl. VAT |
| AKS-60 kit: 5 depths | €165 excl. VAT |
| AKS-90 kit: 7 depths | €205 excl. VAT |
| AKS-120 kit: 9 depths | €265 excl. VAT |
Subscriptions for connected solutions
Most connected solutions include a subscription, which covers access to the app and, depending on the offer, the SIM card. Its price is often not published and is available only on request. Published subscriptions go up to €492 excl. VAT per year, and some offers require farmers to take out a SIM card with an operator themselves. The hub subscription costs from €2 excl. VAT per probe per month, SIM card and 4G data plan included, with no commitment.
Choosing a probe according to your goal, your soil and your irrigation
The choice of a probe depends first on what you expect from the measurement: knowing when to irrigate, or also knowing how much water to apply. The soil type and the irrigation method of the field then guide this choice.
Knowing when to trigger irrigation
Both technologies answer this question. The tensiometric probe answers with a threshold in kPa, published for the crop. The capacitive probe answers with RAW, calculated from the soil texture and the crop.
Knowing how much water to apply and where the water goes
Only water content answers this question directly. The water stored in mm gives the deficit relative to field capacity, and hence the amount to apply, and the deep sensors show whether the water applied drains below the roots21. With a tensiometric probe, determining the amount requires the soil water retention curve15.
Sandy, clay or stony soils
In sandy soils, the Watermark 200SS probe is poor at resolving low tensions, up to the 10 kPa threshold often used for these soils22, whereas the capacitive probe measures the whole moisture range. In clay soils, the water content at field capacity and at the permanent wilting point is high: a high water content therefore does not mean that the water is available to the crop. Both values are calculated from the soil texture. In stony and gravelly soils, tensiometers are unsuitable, and a capacitive probe requires careful installation, with no air gaps around the tube21.
Drip, sprinkler or hose-reel irrigation
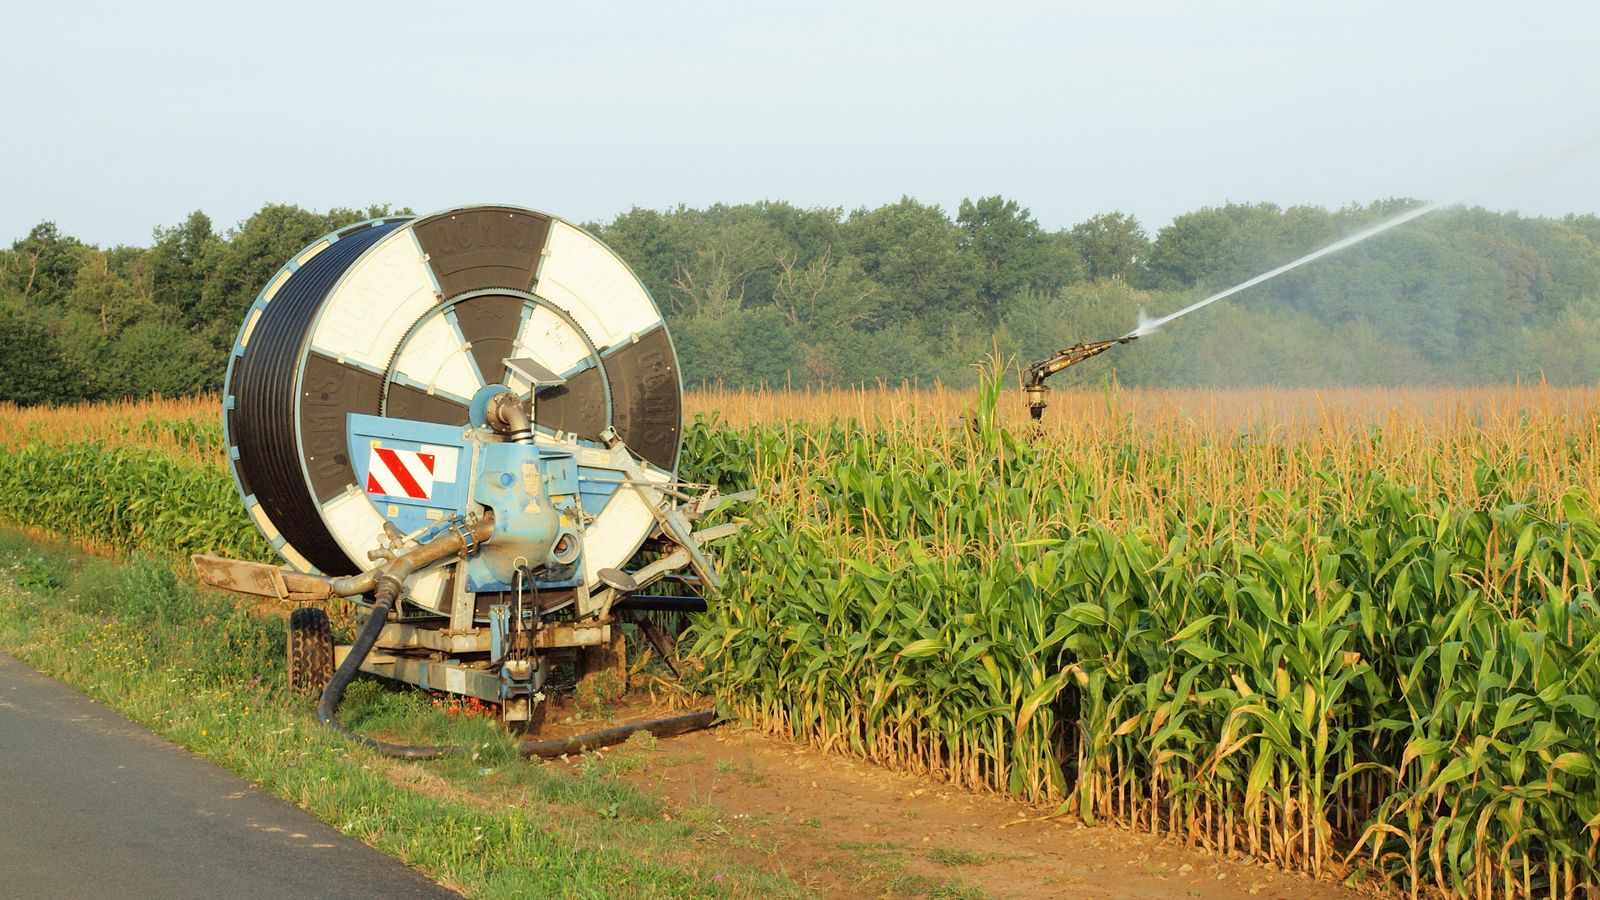
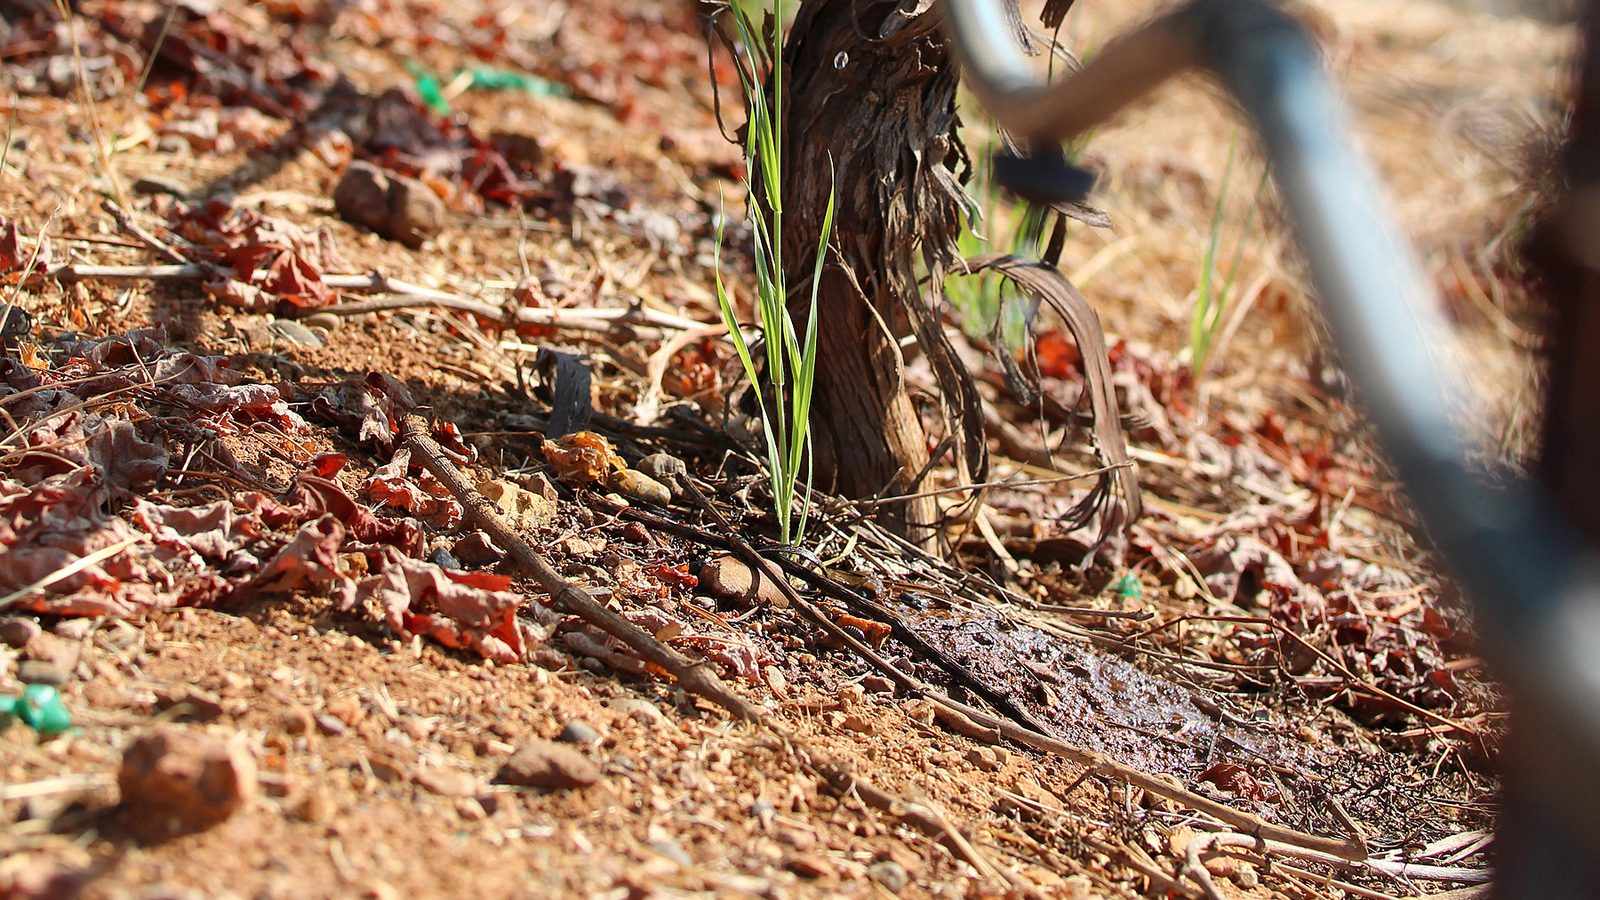
With drip irrigation, water wets a limited volume of soil beneath each emitter: a multi-depth probe installed in this volume shows how deep the water from each irrigation goes. The guide Where should you place a soil moisture probe in your field? sets out where to place the probe for each irrigation system. With sprinklers, centre pivots or hose reels, irrigation amounts are planned in mm, the unit of the water content measured by the capacitive probe. Whatever the crop and the irrigation system, each uniform zone requires at least one monitoring site: the guide How many soil moisture probes should you install on your farm? explains this rule.
Combining a capacitive probe and a tensiometric probe
The two technologies are not mutually exclusive. This section sets out what the two measurements provide together, how to install a tensiometric probe next to a capacitive probe and how to read their curves in the hub.
What the two measurements provide together
Installed at the same monitoring site, a tensiometric probe and a capacitive probe complement each other. Tension reflects the effort the crop is making and makes it possible to use the published kPa thresholds; water content, at several depths, gives the amount in mm and shows where the water goes. Recorded together, particularly during the drainage that follows heavy rain or a heavy irrigation, the two measurements make it possible to estimate the in situ retention curve of the soil, as studies pairing a tensiometric probe with a water content measurement have done26,27.
Installing the tensiometric probe next to the capacitive probe
In one published study, the tensiometers were installed at the depths measured by the capacitive probe, 30 cm from its tube27. The AKS connected 4G gateway accepts 1 to 3 AKS capacitive probes and, on a dedicated input, a Watermark 200SS probe supplied by Akuasense: a single gateway transmits both measurements.
Converting the Watermark probe’s resistance into tension depends on soil temperature18. AKS probes measure soil temperature at each of their depths: the hub corrects each reading of the Watermark probe for the temperature measured by the neighbouring AKS probe, at the chosen depth.
Reading both curves in the hub
In the hub, the curves of the Watermark probe are displayed on the same charts as those of the AKS probes, for comparison, or on separate charts. The farmer can thus follow, on a single screen, the soil moisture at each depth and the tension measured by the Watermark probe.
What soil moisture monitoring brings to irrigation scheduling
A probe measures; the decision to irrigate remains with the farmer, who knows their field, their crop and their water supply. Continuous measurement at several depths complements this experience with a direct view of what is happening below the surface: the response of the soil to each irrigation and each rainfall, how deep the water goes and the rate at which the crop draws water from the soil.
AKS capacitive probes measure soil moisture and temperature every 15 cm, and the hub calculates TAW and RAW for each probe from the soil texture and crop entered by the user, then displays the water status of the field. The guides How many soil moisture probes should you install on your farm? and What soil moisture probe length do I need? help you choose the number and length of probes.
Akuasense professional connected soil moisture probes are available from €135 excl. VAT.
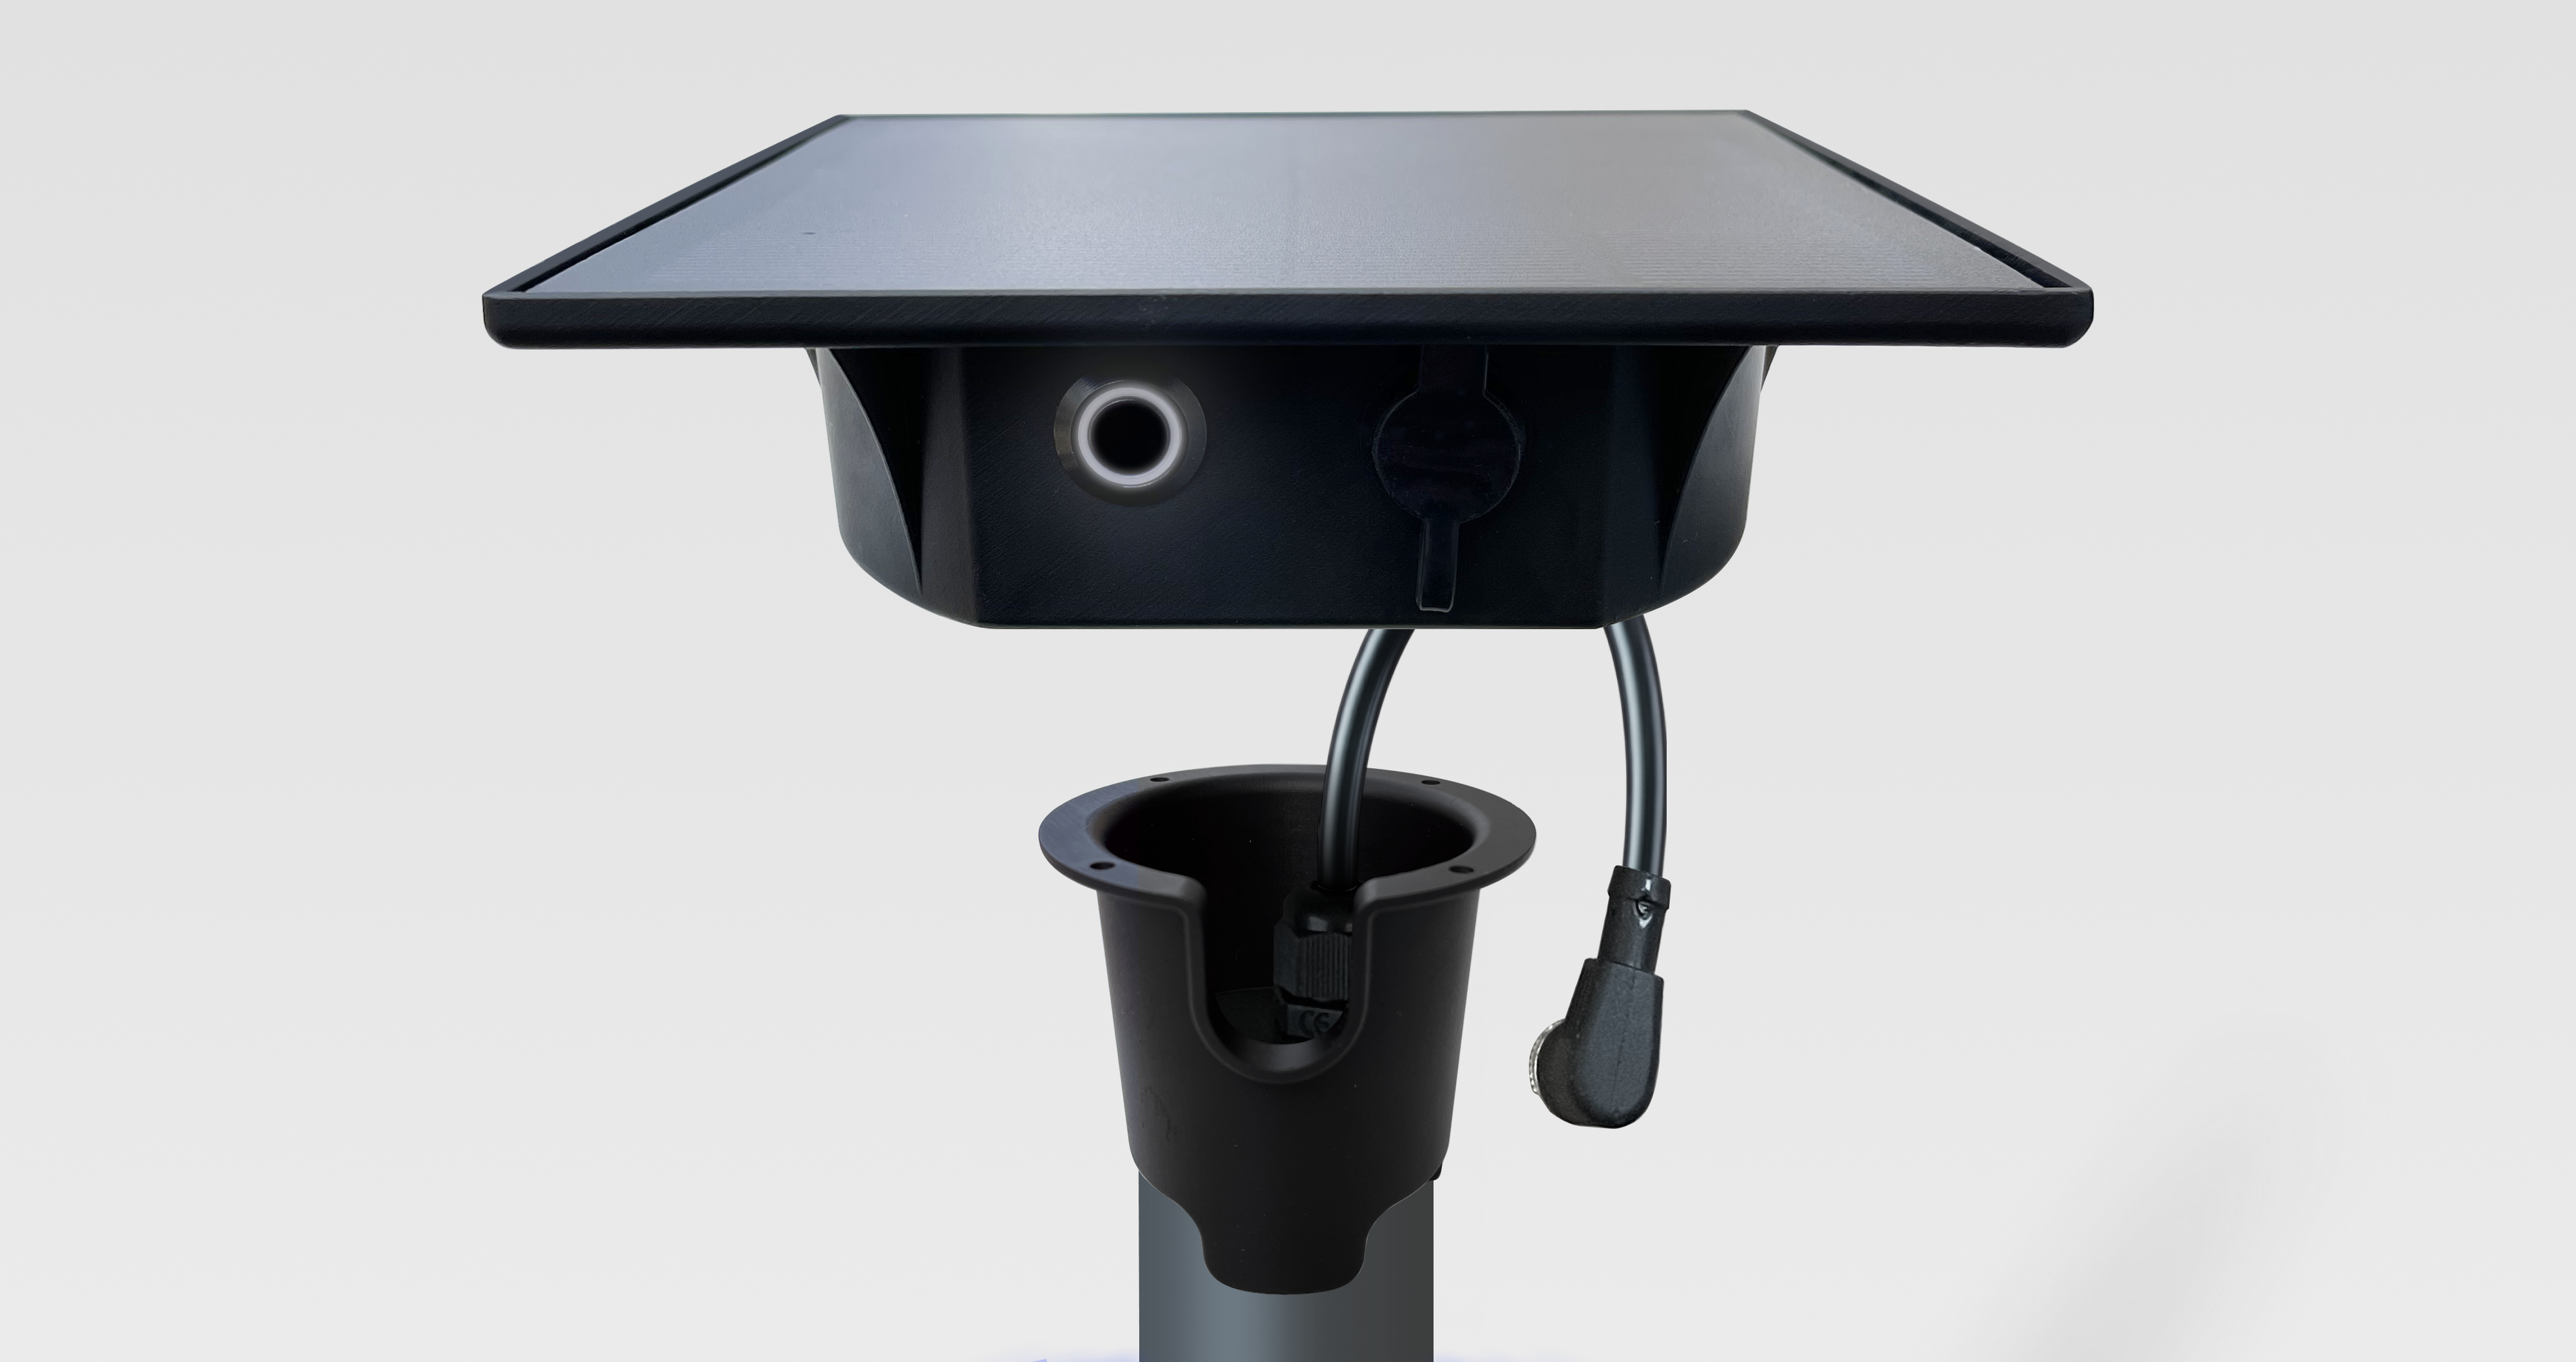
Multi‑depth capacitive soil moisture probes
One capacitive sensor every 15 cm measures volumetric soil moisture and soil temperature throughout the active root zone.
- 3 to 9 depths depending on the model: 30, 60, 90 or 120 cm
- Autonomous gateway with battery and solar panel, for up to 3 probes
- Hourly 4G transmission, SIM card and data plan included
- GPS position of each gateway within the plot
- Designed and assembled in France
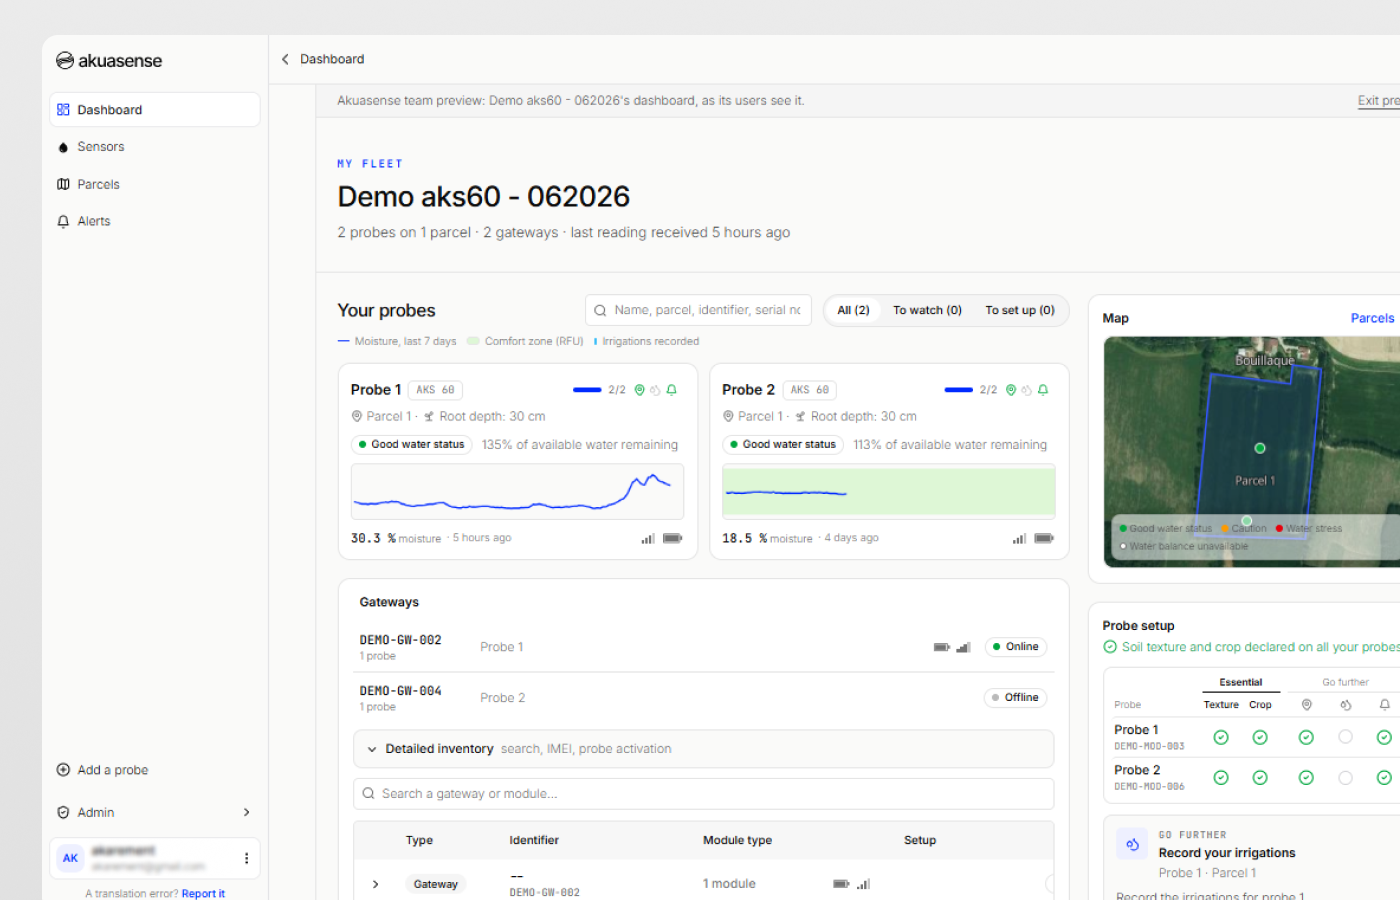
The hub: water monitoring for your plots
The hub centralises the readings of all your probes, on computer, tablet or smartphone.
- Moisture summarised over the root zone, weighted by soil and crop, in detail by depth and as a heatmap
- The water status of each probe at a glance
- Soil temperature, and the battery and signal of each gateway
- Soil texture by depth, crop, irrigation setup and irrigations, shown alongside the moisture curves
- Plot map, built-in weather and email alerts
- Your data accessible through a REST API and an MCP server
FAQ: tensiometric or capacitive probe
What is the difference between a tensiometric probe and a capacitive probe?
A tensiometric probe measures soil water tension, in kPa or centibars, that is, the force with which the soil holds its water: it indicates when to irrigate. A capacitive probe measures the soil's volumetric water content, which can be converted into mm of water. Installed at several depths, a capacitive probe indicates when to irrigate, how much water to apply and how deep the water goes.
How much does a connected tensiometric probe cost?
As of 14 November 2026, a Watermark 200SS probe on its own costs €40 to €62 excl. VAT, without a reader or data transmission. With a connected gateway, a tensiometric probe costs €330 to €524 excl. VAT on the market, and the 6 probes of a complete monitoring site, at 2 depths, €1,270 to €1,650 excl. VAT. On the AKS connected 4G gateway, a Watermark 200SS probe comes to €235 excl. VAT, including the probe on its PVC sleeve and the steel tube.
Can centibars be converted into soil moisture?
The conversion goes through the soil water retention curve, which links tension to water content and depends mainly on texture. According to the Rosetta3 program, for the typical composition of each texture class, a sand holds about 5.9% vol. of water at 100 kPa, and a clay about 31.7% vol. The converter in this article makes this calculation for the 12 texture classes.
What does VWC mean for a soil moisture probe?
VWC stands for volumetric water content: the share of the soil volume occupied by water. A VWC of 30% vol. means 30 litres of water per 100 litres of soil. Capacitive probes, including AKS probes, measure VWC. Multiplied by the soil thickness, VWC gives an amount of water in mm: 1% vol. over 10 cm of soil represents 1 mm of water.
What centibar reading should trigger irrigation?
The threshold depends on the crop, its growth stage, the soil type and the measurement depth. The reference values reproduced by the University of California range, for example, from 30 to 50 kPa for potato, from 50 to 70 kPa for citrus and from 40 to 50 kPa for grapevine early in the season. Thresholds also vary with the soil: for a Watermark probe, the University of Nebraska gives 20 to 25 kPa in fine sand, compared with 75 to 110 kPa in silt loam.
Does a Watermark probe work in sandy soil?
In sandy soil, the Watermark 200SS probe does not measure the lowest tensions. In a study on two sandy soils, the probe did not respond to tension changes below about 10 kPa, whereas these soils are often irrigated as soon as tension reaches 10 kPa. A capacitive probe measures the whole moisture range of a sandy soil.
Can a Watermark probe be connected to an Akuasense gateway?
Yes. The AKS connected 4G gateway has a dedicated input for a Watermark 200SS probe, which Akuasense supplies mounted on a PVC sleeve. The gateway also accepts 1 to 3 AKS capacitive probes; without an AKS probe, it clips onto a 1 m steel tube and sits 50 cm above the ground. The hub displays the curves of the Watermark probe on the same charts as the AKS probes or on separate charts, and corrects its reading for soil temperature when an AKS probe is connected to the same gateway.
How many tensiometric probes should be installed per field?
A tensiometric probe measures only one depth, and two probes installed in the same soil give different readings. A tensiometric monitoring site therefore often has 6 probes, 3 at each of 2 depths, as France's chambres d'agriculture recommend for arable crops. A single AKS capacitive probe measures 3 to 9 depths; in all cases, each uniform zone requires at least one monitoring site.
Sources
- M.I. Zamora Re, T.M. Peplin and A. Tomasek (2026). Soil Moisture Monitoring to Support Irrigation Scheduling, EM 9868. Oregon State University Extension Service. extension.oregonstate.edu
- S. Datta, S. Taghvaeian and J. Stivers (2017). Understanding Soil Water Content and Thresholds for Irrigation Management, BAE-1537. Oklahoma Cooperative Extension Service, Oklahoma State University. extension.okstate.edu
- R.G. Allen, L.S. Pereira, D. Raes and M. Smith (1998). Crop evapotranspiration – Guidelines for computing crop water requirements, FAO Irrigation and Drainage Paper 56, chapter 8. FAO. fao.org
- R. Muñoz-Carpena (2004, reviewed 2021). Field Devices for Monitoring Soil Water Content, BUL343. UF/IFAS Extension. edis.ifas.ufl.edu
- USDA Agricultural Research Service (updated 2019). Rosetta class average hydraulic parameters. ars.usda.gov
- D.G. Chandler, M.S. Seyfried, J.P. McNamara and K. Hwang (2017). Inference of Soil Hydrologic Parameters from Electronic Soil Moisture Records. Frontiers in Earth Science 5:25. doi:10.3389/feart.2017.00025
- Soil Science Society of America (n.d.). Glossary of Soil Science Terms. sciencesocieties.org
- S. Irmak, J.O. Payero, B. VanDeWalle, J. Rees, G. Zoubek, D.L. Martin, W.L. Kranz, D.E. Eisenhauer and D. Leininger (revised 2016). Principles and Operational Characteristics of Watermark Granular Matrix Sensor to Measure Soil Water Status and Its Practical Applications for Irrigation Management in Various Soil Textures, EC783. University of Nebraska–Lincoln Extension. extensionpubs.unl.edu
- G.C. Topp, J.L. Davis and A.P. Annan (1980). Electromagnetic determination of soil water content: Measurements in coaxial transmission lines. Water Resources Research 16(3):574-582. doi:10.1029/WR016i003p00574
- M. Cahn and B. Farrara (n.d.). Using tensiometers for scheduling irrigations of coastal vegetables. University of California Agriculture and Natural Resources. ucanr.edu
- R.T. Peters, K. Desta and L. Nelson (2013). Practical Use of Soil Moisture Sensors and Their Data for Irrigation Scheduling, FS083E. Washington State University Extension. wsu.edu
- T. Ochsner (2019). Rain or Shine: An Introduction to Soil Physical Properties and Processes, section 3.3. Oklahoma State University Libraries. open.library.okstate.edu
- M.Th. van Genuchten (1980). A Closed-form Equation for Predicting the Hydraulic Conductivity of Unsaturated Soils. Soil Science Society of America Journal 44(5):892-898. doi:10.2136/sssaj1980.03615995004400050002x
- Y. Zhang and M.G. Schaap (2017). Weighted recalibration of the Rosetta pedotransfer model with improved estimates of hydraulic parameter distributions and summary statistics (Rosetta3). Journal of Hydrology 547:39-53. doi:10.1016/j.jhydrol.2017.01.004
- J.D. Jabro, W.B. Stevens, W.M. Iversen, B.L. Allen and U.M. Sainju (2020). Irrigation Scheduling Based on Wireless Sensors Output and Soil-Water Characteristic Curve in Two Soils. Sensors 20(5):1336. doi:10.3390/s20051336
- R. Schattman, H. Jean, J. Faulkner, R. Maden and B.K. Chim (2023). Soil water availability monitoring for diversified vegetable farms. University of Maine and University of Vermont Extension. uvm.edu
- H. Gabriel and J. Nedellec (n.d.). Les outils d'aide au pilotage de l'irrigation : les sondes tensiométriques et capacitives [Irrigation scheduling tools: tension sensors and capacitance probes]. Chambre d'agriculture du Tarn. tarn.chambres-agriculture.fr
- E.J.A. Spaans and J.M. Baker (1992). Calibration of Watermark soil moisture sensors for soil matric potential and temperature. Plant and Soil 143:213-217. doi:10.1007/BF00007875
- I.R. McCann, D.C. Kincaid and D. Wang (1992). Operational characteristics of the Watermark Model 200 soil water potential sensor for irrigation management. Applied Engineering in Agriculture 8(5):603-609. doi:10.13031/2013.26131
- R.B. Thompson, M. Gallardo, T. Agüera, L.C. Valdez and M.D. Fernández (2006). Evaluation of the Watermark sensor for use with drip irrigated vegetable crops. Irrigation Science 24(3):185-202. doi:10.1007/s00271-005-0009-5
- Irrigation New Zealand (2025). Soil Moisture Monitoring, Book 11, revised edition (J. Robb, S. McNally, P. Smith and J. Hargreaves). mhvwater.nz
- S. Irmak and D.Z. Haman (2001). Performance of the Watermark granular matrix sensor in sandy soils. Applied Engineering in Agriculture 17(6):787-795. doi:10.13031/2013.6848
- J. Robb (2025). Soil Moisture Measurement System Selection Guide, version 1.0. Irrigation New Zealand. mhvwater.nz
- N. Vallez (n.d.). Les mardis pour produire… piloter l'irrigation en s'appuyant sur la connaissance de l'état hydrique de son sol [Tuesdays for producers: scheduling irrigation based on knowledge of the soil's water status]. Chambre d'agriculture de Tarn-et-Garonne. agri82.chambre-agriculture.fr
- B.R. Hanson, S. Orloff and D. Peters (2000). Monitoring soil moisture helps refine irrigation management. California Agriculture 54(3):38-42. doi:10.3733/ca.v054n03p38
- J.D. Jabro, R.G. Evans, Y. Kim and W.M. Iversen (2009). Estimating in situ soil–water retention and field water capacity in two contrasting soil textures. Irrigation Science 27(3):223-229. doi:10.1007/s00271-008-0137-9
- Í.V. do Nascimento, A. dos S. Queiroz, L. de S. Oliveira, J.M.R. dos Santos, T. da C.D. Moniz, R.N. de Assis Júnior, H.H. de F. Sousa, J.C. de Araújo, C.T. dos S. Dias, C.P. da Silva, M.G.R. Lobato and J.C.A. Mota (2025). Frequency domain reflectometry and Hydrus-1D for parameterizing the van Genuchten equation in a sandy entisol. Discover Soil 2:93. doi:10.1007/s44378-025-00116-6